4. Policies to address waiting times can target the supply side, the demand side, or both
Policies to reduce waiting times can increase supply, reduce or better manage demand, or both (Box 4.1). The most common policy remains the introduction of a maximum waiting time, which can be used to mobilise efforts to bring together the supply and demand in a variety of ways. It can be used by governments to establish some overall objective or target for various health services at the system level. It can also be used as a target at the provider level or to give patients a guarantee that treatment will be given within a certain time limit. When waiting times are specified as a target, regulators and funders may use it as an accountability measure for providers, with possible consequences when the target is not met. When maximum waiting times are specified as a guarantee, they can be enforced through the law or provide patients with the right to change provider. If not specified as a target, a guarantee or linked to specific actions, maximum waiting times act more as an ambition than a policy lever.
Waiting times are a dynamic phenomenon. They increase over time if demand exceeds the supply, and reduce if supply exceeds demand. Both demand and supply are likely to grow over time. Demand increases over time because of population ageing, which increases needs, or through technological development, which increases the range of conditions that are treatable. Supply may also increase over time due to technological development, which for example allows patients to be treated as day cases in hospitals, possibly allowing a larger number of patients to be treated over a given week or month. This dynamic element implies that periods of increasing supply can be associated with increasing waiting times if demand grows at a faster rate.
The demand for treatments in public systems is also determined by other factors beyond ageing and technology, such as patient preferences for surgery, patient cost-sharing (e.g. co-payments, coinsurance rates), the extent to which the population holds (duplicative) private health insurance and the price and accessibility of private care (Figure 4.1).
The supply of treatments is determined by the overall capacity which depends on the health workforce and its composition, and infrastructure and equipment (e.g. number of primary care facilities, clinics and hospitals, and diagnostic and surgical equipment). However, it is not only the availability of labour and capital, but also the productivity with which the capacity is used that determines the supply. Productivity will depend on contractual arrangements with health workers (hours, number of sessions) and payment systems (e.g. for doctors and nurses) and at the organisation level (hospital and primary care facilities). Incentives to increase supply are stronger when health workers are paid by fee for service as opposed to salaried or capitation, and provider payments are based on activities, although this might also generate some supply-induced demand.
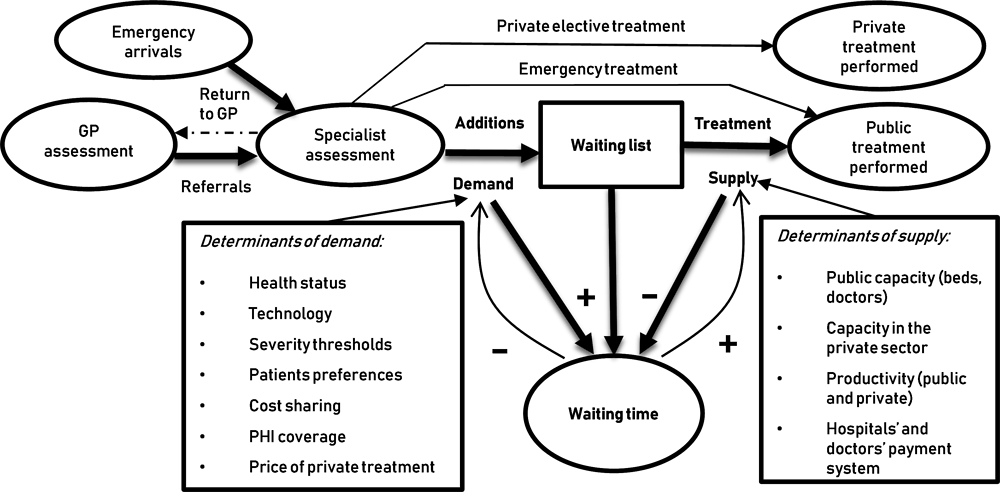
Source: Adapted from Hurst and Siciliani (2003[32]), “Tackling Excessive Waiting Times for Elective Surgery: A Comparison of Policies in Twelve OECD Countries", OECD Health Working Papers, No. 6, https://doi.org/10.1787/108471127058.
As shown in Figure 4.1, a number of supply-side policies can be used to reduce waiting times, with the most common ones being to increase resources (human and/or technical) and productivity. Other policies act on the demand side, mostly aiming at prioritising patients based on need to avoid adding them to the waiting list when there is little or no expected benefits, reducing inappropriate referrals, tests and procedures, or redistributing waiting times across patients with different severity (so that patients with more severe conditions wait less).
The next sections review maximum waiting times that OECD countries have set and some of the main policy actions on the supply and the demand side to achieve these goals in four clinical areas:
1. Specialist consultations and elective treatments;
2. Consultations with GPs and other primary care providers;
3. Cancer care (diagnosis and treatment); and
4. Mental health services (diagnosis and treatment).
4.1. Policies to reduce waiting times for specialist consultations and elective treatments
The most common policy used across OECD countries to reduce waiting times for specialist consultations and elective treatments is to establish a maximum waiting time. As illustrated in Table 4.1, maximum waiting times vary across countries. Some countries specify maximum waiting times only for specific treatments, others for all treatments. The segment of the patient pathway over which the maximum applies also differs. Most countries have a maximum wait specified for an elective treatment following a specialist assessment, yet others specify it from the GP referral to treatment. Others also have a maximum waiting time for specialist consultations and diagnostic tests. The same maximum waiting time can apply to all the patients within the same type of service, or different maximum can be applied to different sub-groups, usually in relation to clinical categorisation and severity of conditions.
Maximum waiting times for the same service or treatment can differ extensively across countries, which may in part reflect different constraints on funding and resources. For example, the maximum waiting time for a cataract surgery ranges from one month in Denmark to 1.5 years in Estonia. Regarding consultations with specialists, it ranges from 3 weeks in Finland up to a target that 80% of patients should get a first outpatient appointment with a specialist within 52 weeks in Ireland.
While all these countries start by setting maximum waiting time targets for specialist consultations and/or elective treatments, the way these maximums are used differs significantly across countries. The description of the policies across the OECD countries fall in five categories:
1. Maximum waiting times targets for providers (e.g. Finland, England)
2. Maximum waiting times guarantees allowing greater patient choice of providers (e.g. Denmark and Portugal)
3. Increased supply to achieve progress towards maximum waiting time objectives (e.g. the Netherlands, Ireland, Canada, Costa Rica)
4. Improving demand management by prioritising patients on the list (e.g. New Zealand, Norway)
5. Improved coordination between primary and secondary care to reduce unnecessary referrals to specialists and waiting times for specialist assessment when needed (e.g. New Zealand, Canada, Italy).
It is important to recognise that these groups are not mutually exclusive ant that each country may have introduced elements of different policies at the same time or may have changed their policy mix over time.
4.1.1. Maximum waiting times have been used as a target for providers in Finland and the United Kingdom and can be successful in reducing waiting times through supply and demand side responses
Both Finland and England have used maximum waiting times as targets for providers or in the case of Finland for municipalities, with sanctions for providers not making progress towards the targets in some cases and strong regulatory oversight. The introduction of these policies has been successful in reducing waiting times significantly starting from very high levels in both countries.
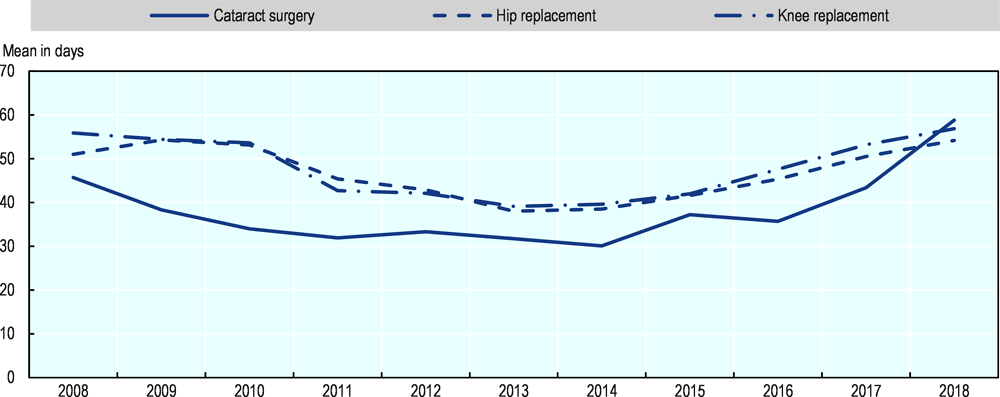
In Finland, some maximum waiting times for specialist consultation and elective treatment were specified as targets in 2005 as part the broader Health Care Guarantee. It was then included into legislation through the Finnish Health Care Act in 2010. The Act stated that patients should have a specialist consultation within 3 weeks following a referral from a GP or other primary care providers; for elective surgery, any evaluation should occur within three weeks, and diagnostic tests within 3 months; and if surgery is needed, this should normally occur within 3 months from the assessment but can be extended to 6 months for non-urgent interventions. A regulatory agency (the National Supervisory Agency Valvira) played a key role in supervising the implementation of these waiting times guarantees and had the authority to penalise municipalities that failed to meet them. It provided targets to municipalities for progressive reductions in the number of patients waiting over 6 months, and by early 2012 had issued 30 orders for improvement, including 8 with a threat of fines (Siciliani, Borowitz and Moran, 2013[1]).The introduction of the guarantee led to a significant decline in waiting times for elective surgery starting in 2005, which has been sustained since then (Figure 4.2).1
Source: OECD Health Statistics.
The policy emphasis in Finland has been on setting and achieving the maximum waiting times targets, with providers and municipalities responsible to implement policies and actions (either on the supply- or the demand side) to achieve these targets.
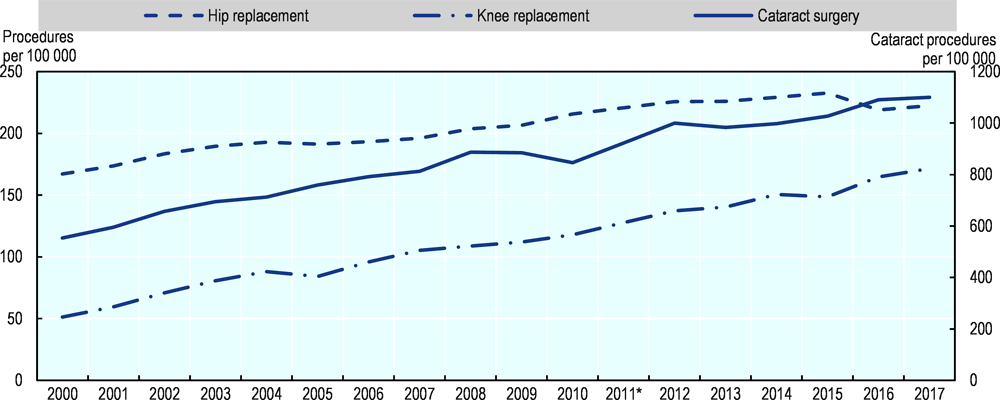
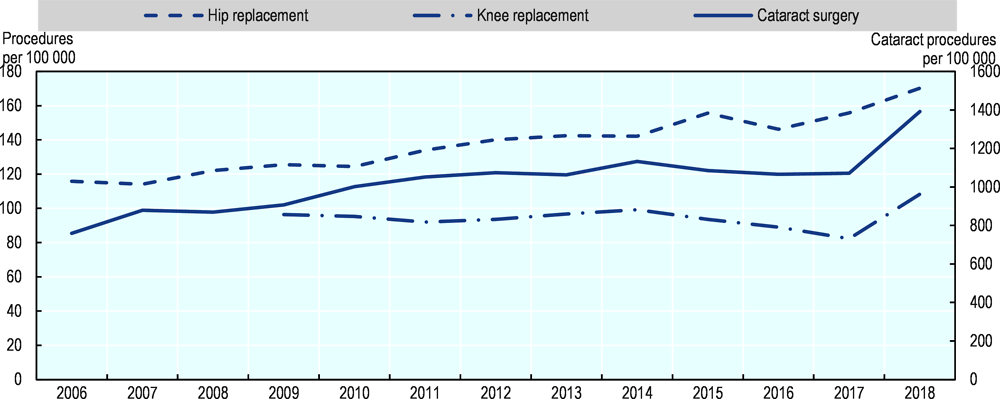
Figure 4.3 shows that the supply of elective operations continued to increase after 2005. This suggests that the reductions in waiting times were achieved by a mix of supply-side measures and better management of the demand. Although Finland has managed to maintain the reduction in waiting times after 2005, waiting times are still relatively high compared to other countries like Denmark and there is scope for further reductions (Figure 2.3).
Source: OECD Health Statistics.
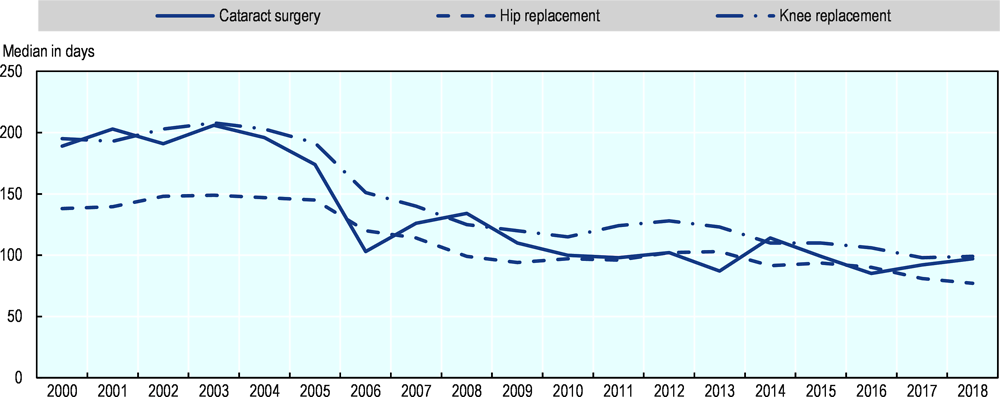
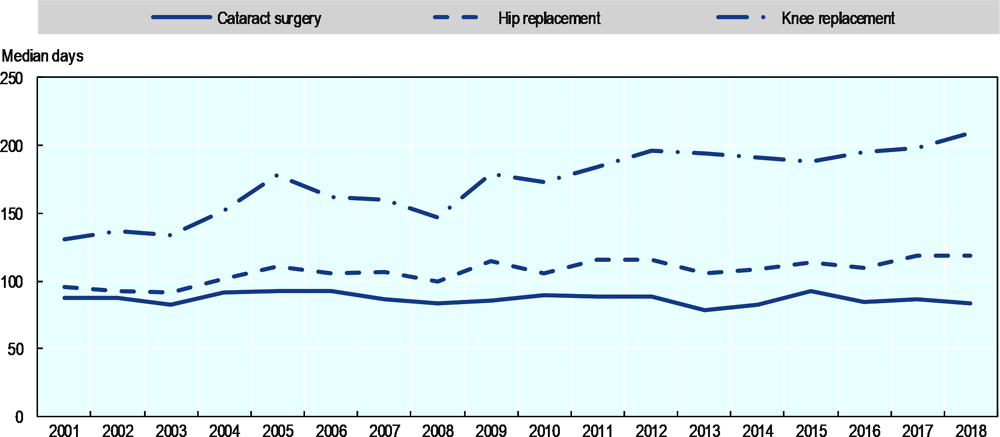
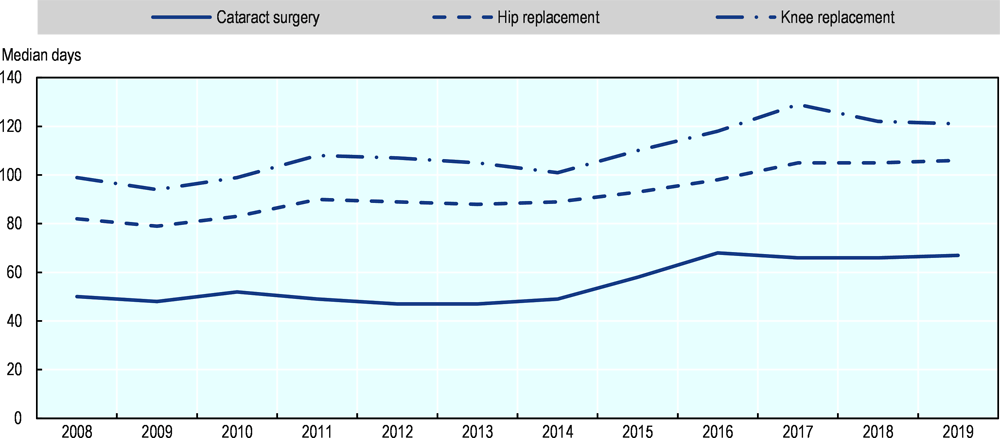
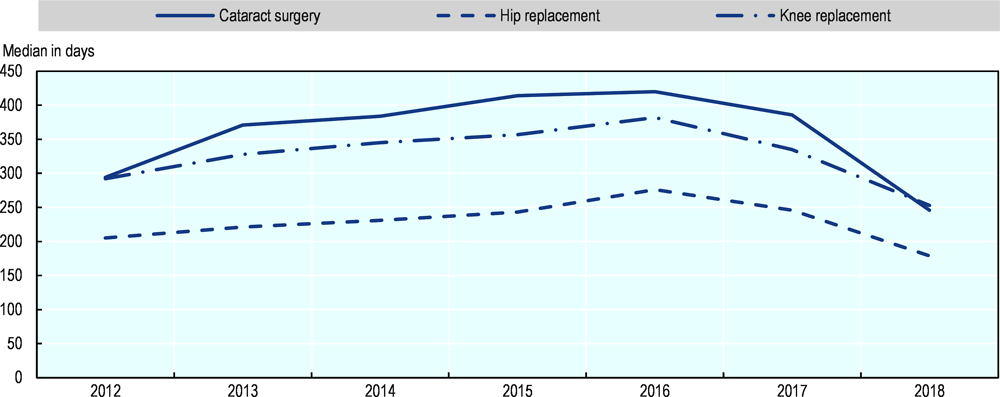
In England, maximum waiting time guarantees were set respectively at 12 months in 2002-03 and 9 months in 2003-04, and then progressively reduced to 18 weeks by 2006. Targets with penalties were introduced in 2000-05, with strong political oversight from the Prime Ministerial Delivery Unit and the Health Care Commission. These contributed to dramatic reductions in waiting times for several elective surgeries between 2000 and 2008. The median waiting times was cut down by more than half for hip and knee replacement as well as for cataract surgery (Figure 4.4).
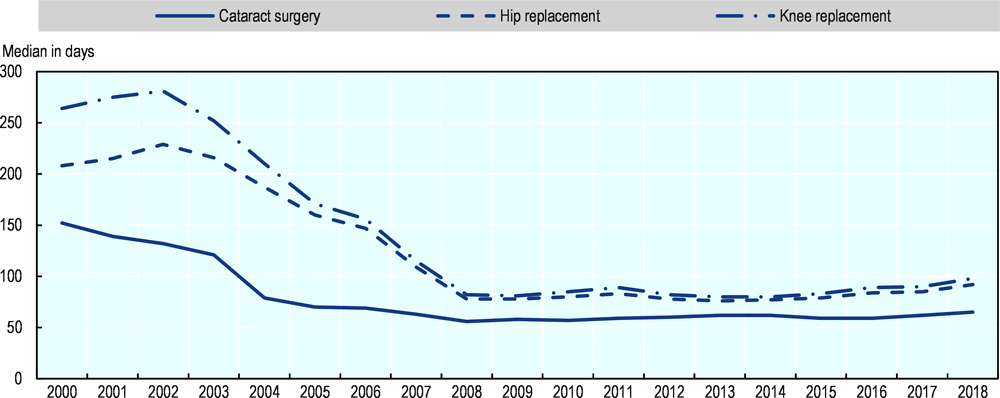
Note: The data relate to Great Britain (England, Scotland and Wales).
Source: OECD Health Statistics.
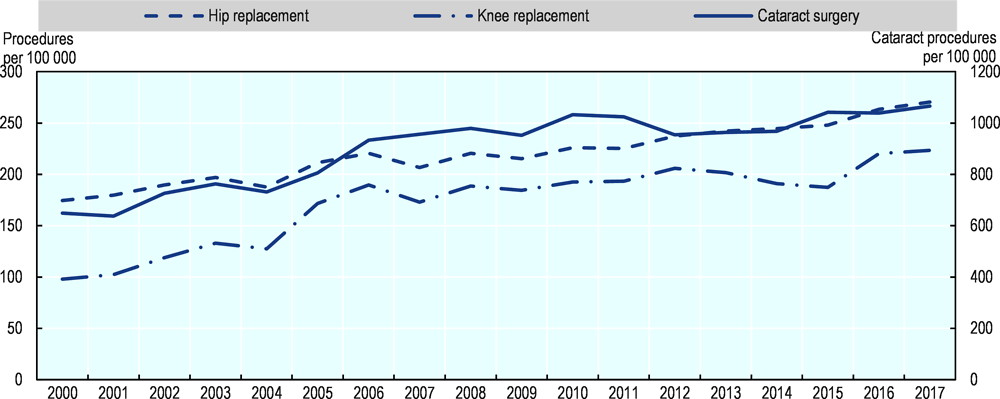
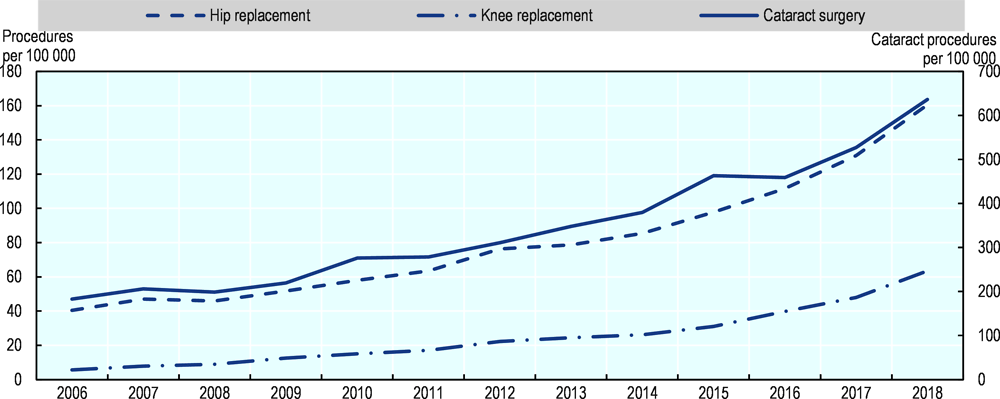
As has been the case in Finland, the reduction in waiting times for both knee and hip replacement between 2000 and 2008, and to some extent also cataract surgery, is partly linked to an increase in surgical activity rates (Figure 4.5), though the very sharp reductions in waiting times during that period (relative to the following period from 2009-18) suggest that better management of demand also played a role.
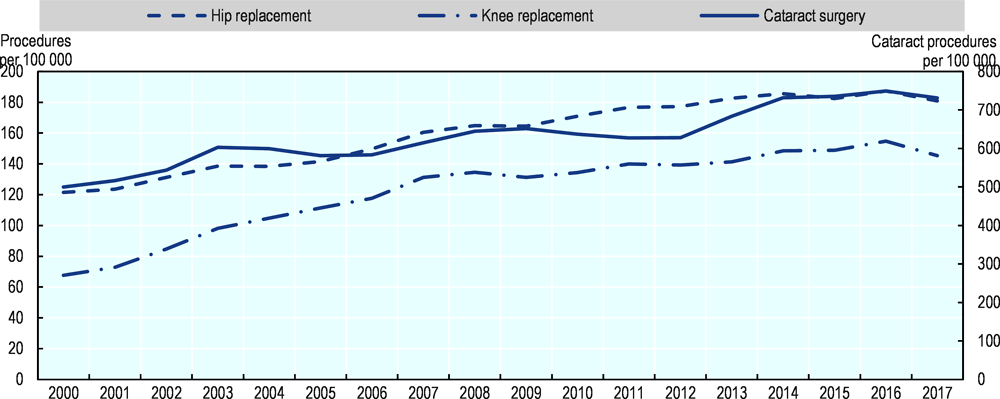
Source: OECD Health Statistics.
In 2010, waiting times guarantees were codified into the NHS Constitution, where patient entitlement to the 18 weeks maximum referred to the waiting time between GP referral to treatment (RTT). The RTT standard is set out in secondary legislation (The National Health Service Commissioning Board and Clinical Commissioning Groups (CCG) Regulations 2012). It requires that NHS England and CCGs make arrangements to ensure that at least 92% patients referred to see a consultant-led team should start their treatment within 18 weeks. In 2013, about 94% of patients on the list (known as “incomplete pathway”) were waiting less than 18 weeks, but this proportion has progressively decreased to 86% in 2018, which has coincided with a period of slower growth in health spending. The median waiting time has increased from 5.6 weeks in April 2013 to 7.2 in April 2019.
The Long-Term Plan commits to help reduce waiting times against this standard. The Plan includes a reform of outpatient services to: a) reduce the number of appointments with specialists that may not be needed; and b) increase variety of access to appointments (e.g. through increased use of digital services). There are also plans to allocate sufficient funds over the next years to increase the volume of planned surgery and reduce long waits. Again, these interventions reflect a mix of demand and supply measures to achieve reductions in waiting times.
4.1.2. Maximum waiting times have been linked to greater patient choice of provider with some degree of success in Denmark and Portugal
Two countries, Denmark and Portugal, have linked maximum waiting times with patient choice policies and some involvement of the private sector when waiting times reach certain levels. These policies have contributed to reductions in waiting times in Denmark that have been sustained over time, while reductions in waiting times were achieved initially in Portugal but have proven more difficult to sustain in recent years. The reductions in waiting times in Denmark are smaller relative to those obtained in Finland and England, which is also due to the much lower initial levels.
Since 2002, patients in Denmark are guaranteed a maximum waiting time from a GP or specialist referral to treatment, initially set at two months but then reduced to one month in 2007. If the region cannot ensure that treatment will be initiated within one month, patients have the right to some ‘extended free choice of hospital’. This means that patients may choose to go to a private hospital in Denmark or to a public or private hospital abroad. If the treatment is provided outside of the region’s own hospitals, the expenses are covered by the originating region through a DRG tariff, thereby providing incentives for regions to keep patients within the county. Waiting time declined after 2002, with the proportion of patients using private sector providers under free choice increasing from 2% to about 5% between 2006 and 2010 (Siciliani, Borowitz and Moran, 2013[1]). Figure 4.6 shows that the reduction in waiting times for selected surgical procedures has been achieved between 2005 and 2018, but with some fluctuations from year-to-year. As shown in Figure 2.3, waiting times are generally low relative to other countries (about 2 to 6 weeks depending on the procedure), despite a definition of waiting time that is broader and includes the time from a GP or specialist referral to treatment.
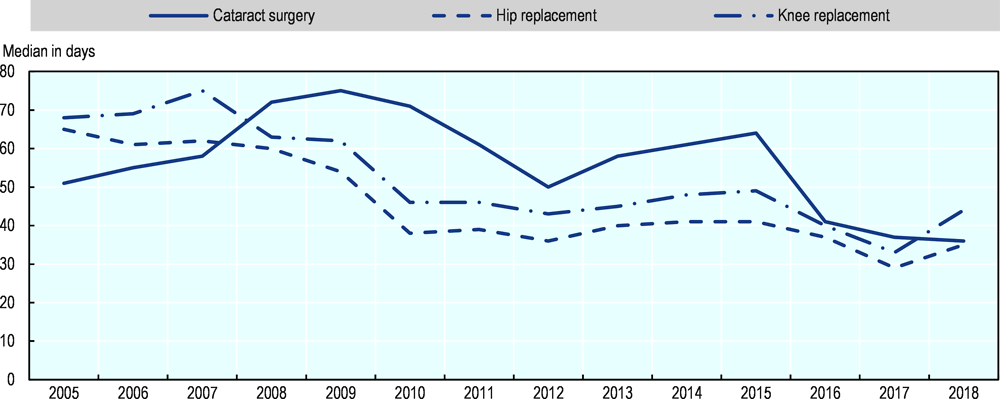
Note: Waiting times for some elective surgery like cataract operations increased in 2008 and 2009 because a hospital dispute in May 2008 led to the postponement of all non-urgent operations, which were rescheduled after the summer 2008. By the end of the dispute, a substantial backlog had built up, which took some time for hospitals to clear.
Source: OECD Health Statistics.
The extended free patient choice policy still holds and also applies to hospital referrals. The regions are required to ensure that any patient referred to a hospital is assessed within one month from the date of referral. If, for medical reasons, it is not possible to determine the condition of the patient within one month, the patient must receive a detailed plan to ensure further investigation of his/her health problem (including, for example, further examinations at another hospital). If because of limited capacity, the region is not able to provide such an assessment within 30 days, the extended free choice of hospital applies (i.e. the patient may go to a private hospital or a hospital abroad to be diagnosed).
After several policies that involved additional funding with limited effects, Portugal introduced in 2004 a policy combining a new mandatory integrated information system (known as the SIGIC) with waiting time guarantees. This policy also involved a voucher system such that when the patient on the list reaches 75% of the maximum time, a voucher is issued that allows the patient to seek treatment at any provider, including in the private sector. Between 2005 and 2010, the national waiting list for surgery declined by 39% (Siciliani, Borowitz and Moran, 2013[1]), and the median waiting times for selected elective surgeries also declined (Figure 4.7).
However, some of these earlier reductions have not been sustained in recent years, and waiting times have increased again since 2011. The average waiting time for surgical treatments was 2.9 months in 2015 and slowly increasing to 3.3 months in 2018. This is despite a 6% growth in surgery over this period (from about 560 000 to 595 000), but this fell short of the 7% increase in the number of people that were added to the waiting list (which rose from about 660 000 to 705 000) (OECD waiting time policy questionnaire, 2019).
Source: OECD Health Statistics.
SIGIC is being replaced with a new information system, SIGA (Access to Healthcare Integrated System), which is more patient-centred. It provides a horizontal and integrated approach to monitor waiting times along the patient pathway in five phases: Phase 1 – Referral from hospital to primary care; Phase 2 – Referral from primary care to hospital; Phase 3 – Referral intra and inter hospitals; Phase 4 – Referral from NHS contact centre to hospitals and primary care; and Phase 5 – Referral to and from the National Network of Long-Term Care. The current maximum waiting times for elective treatment is 180 days (for normal priority level), 120 days for specialist visits and 90 days for diagnostic tests such an MRI or a CT scan. Other initiatives under the “Access to healthcare improvement plan” include improving the prioritisation of the waiting list by setting waiting times based on clinical priority, benchmarking, and improved coordination protocols between hospitals and primary care units.
Since 2016, there is “Free Circulation of Patients” for specialist visits with patients being offered the possibility to choose another hospital in the NHS to the one they are regularly referred to. In consultation with the GP, patients can choose the hospital taking into account the waiting times published in the NHS portal (http://tempos.min-saude.pt/#/instituicoes), which provides waiting times also for surgery.
4.1.3. Many countries focus on increasing supply as the main policy lever to reduce waiting times, but these can be expensive or not successful in achieving lasting reductions
Several countries (e.g. the Netherlands, Ireland, Australia, Canada, Hungary, Estonia, Poland and Slovenia) have tried to reduce waiting times mainly by increasing the supply of services and procedures with different degrees of success, and many other countries are planning to introduce such measures. Supply can be increased through dedicated funding, by inducing doctors and other members of health care teams to do additional sessions and longer hours, and by recruiting additional staff. This policy is expensive and will lead to reductions in waiting only if the increase in supply outweighs the increase in demand, and if the health system does not respond to higher volumes by a commensurate increase in referrals and procedures that inflates demand (a form of supply-induced demand). Supply can also be increased through greater efficiency of the operating theatre and work organisation.
In the Netherlands, the national associations of hospitals and insurers agreed in 2000 on a socially acceptable waiting time (known as “Treek norms”) of six weeks (80% within four weeks) for day treatment and seven weeks (80% within five weeks) for in-patient treatment, and four weeks (80% within three weeks) for hospital specialist diagnosis and medical assessment. This was also motivated by a court decision stating that patients had an enforceable right to timely health care.
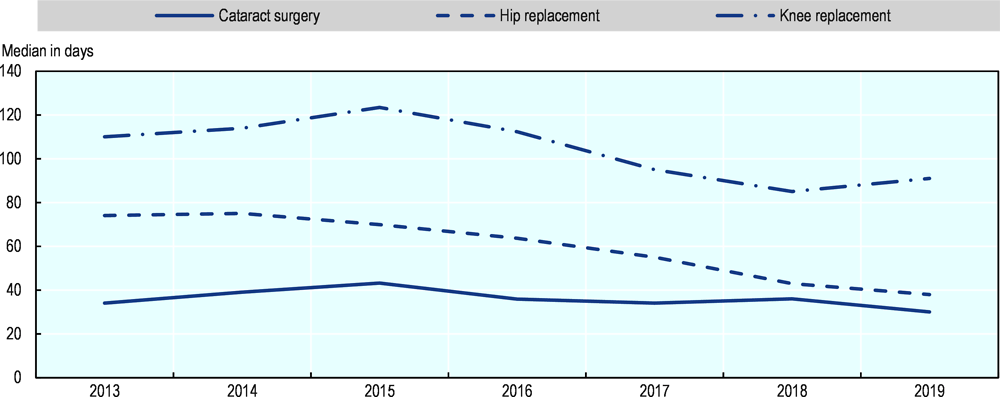
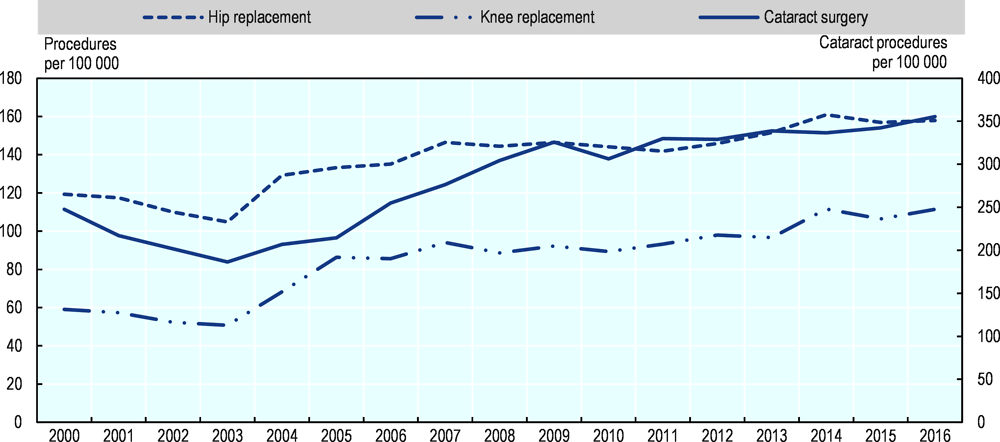
Several initiatives to increase the supply of services were introduced at the same time. In 2001, hospital reimbursement changed from fixed budget to activity-based payments, and restrictions on the number of medical specialists in hospitals were abolished. Waiting times decreased substantially to about 5 weeks on average for cataract surgery in 2010 and 7 weeks for hip and knee replacement (Figure 4.8), down from over 12 weeks for these three interventions in 2000 (Siciliani, Borowitz and Moran, 2013[1]). This was linked at least partly to an increase in surgical activities during that period (Figure 4.9). Waiting times remained low until 2013-14 but have since then started to increase again, possibly due to the re-introduction of budget caps that has limited the supply in the face of growing demand.
Note: The data start in 2008 because there is a break in the series in that year.
Source: OECD Health Statistics.
Note: There is a data gap for all procedures in 2011, which has been estimated as the average of surgical activity rates in 2010 and 2012.
Source: OECD Health Statistics 2019.
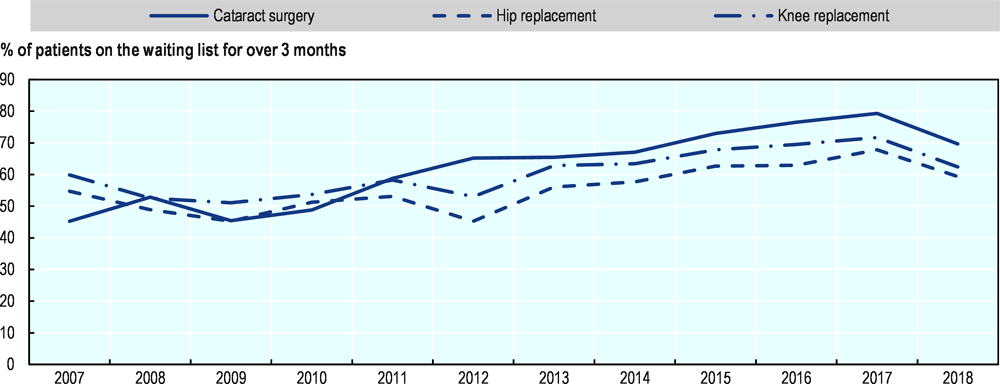
Ireland has also introduced many maximum waiting times targets and supply-side measures to try to reduce long waiting times for different health services, including specialist consultations and elective surgery, with uneven success. The National Service Plan increased the funding available to the Health Service Executive (HSE) by an average of 5% per year in 2018 and 2019 to respond to growing demands for health care, including specialist care and elective care, following substantial increases between 2012 and 2017. The increased funding and activities has contributed to a reduction in waiting times in 2018, with the number and share of patients waiting over 3 months falling significantly in 2018 (Figure 4.10). This has also been the case for the number of patients waiting over 9 months, which has come down from 28 100 in July 2017 to 14 900 at the end of 2018. By the end of 2018, 84% (93%) of adults waited less than 15 months for an elective inpatient (day case) procedure, which falls short of the targets of 90% (and 95%); and 90% (84%) of children waited less than 15 months for an elective inpatient (day case) procedure, falling short of the 90% target for day cases; 70% of patients were waiting less than 52 weeks for first outpatient appointment. While waiting times for elective surgery has started to come down in 2018, they remain higher than in 2012, and generally waiting times in Ireland remain high relatively to many other OECD countries (Figure 2.3).
Source: National Treatment Purchase Fund (the data refer to the situation in mid-year, end of June).
The objective in 2019 is to further reduce the number of patients waiting longer than 3 (9) months from 40 200 (14 900) at the end of 2018 to 31 000 (10 000) at the end of 2019. The Department of Health oversees the performance of the HSE and the National Treatment Purchase Fund (NTPF) against agreed targets. This includes weekly analysis of waiting list figures provided by the NTPF and regular review meetings with the HSE and the NTPF. The Department of Health has also convened a Working Group to examine current and projected demand and capacity to deliver services, with a view to improve access to elective care in the short, medium, and long term in different specialty areas (e.g. orthopaedics, dermatology, ophthalmology, urology and gynaecology).
In Australia, the 2011-15 National Partnership Agreement on Improving Public Hospital Services between the Australian Government and all states and territories agreed on some National Elective Surgery Targets as well as a National Emergency Access Target. States and territories received additional government funding to improve facilities and undertake process redesign, and reward payments if they met or partially met the agreed-upon targets each year. The former Council of Australian Governments (COAG) reported publicly on the progress of states and territories towards achieving these targets. In its last report from 2014, it found that no state or territory met all their 2013 elective surgery targets, though some were met.
The dedicated investments in elective surgery during the term of the 2011-15 Agreement were only sufficient to meet the growing demand, without any significant impact in reducing waiting times. Between 2015 and 2018, waiting times for cataract surgery have declined slightly, but they have increased slightly for knee replacement and hip replacement (Figure 4.11). Although Australia does not currently have a national policy to reduce waiting times for elective surgery, the government still regularly evaluates waiting times in public hospitals based on nationally agreed performance indicators on waiting times. The Australian Institute of Health and Welfare compiles the data provided by the states and territories to produce the Australian hospital statistics series of annual reports.
Source: OECD Health Statistics.
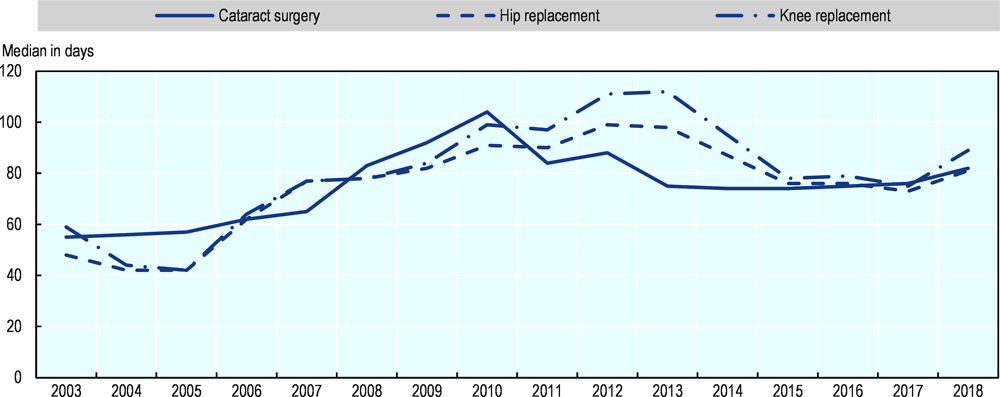
In Canada, federal, provincial and territorial governments committed in 2004 on a ten-year plan to reduce waiting times for some elective surgery, including cataract and hip and knee replacement and to improve the reporting of waiting times data. Between 2008 and 2014, the median waiting times for these three elective surgical procedures remained relatively stable, but they have increased since 2014 (Figure 4.12). The demand for these procedures has increased more rapidly than the number of surgeries due to population ageing as well as increases in the prevalence of conditions such as osteoarthritis and obesity (CIHI, 2019[33]). The province of British Columbia in Canada announced in 2018 that it would be completing approximately 9 400 more surgeries in the public health care system by March 2019, with a focus on improving surgical pathways, coordination of care and information to patients.
Source: OECD Health Statistics.
Hungary has achieved progress in reducing waiting times for elective surgery over the past five years through the implementation of its 2014-2020 strategy for the health sector, which includes supply-side measures along with better management of demand (Figure 4.13). As a result, waiting times for elective surgery in Hungary is much lower than in all other Central and Eastern European countries that report these data (Figure 2.3).
One of the main objectives of the 2014-2020 strategy is to reduce waiting times to less than 60 days for minor surgery (like cataract surgery) and less than 180 days for major surgery (like hip and knee replacement) for all patients across the country. This involves efforts to reduce regional inequalities in timely access of elective care. To achieve this goal, the government has adopted new laws and regulations regarding the management of waiting lists, that are supported by the development of an online waiting list system at the national level to monitor the situation in real-time. It also provided additional payments to reduce waiting times in selected clinical areas and hospitals, and encouraged a reallocation of patients from providers with longer waiting times to those with shorter waiting times.
Source: OECD Health Statistics.
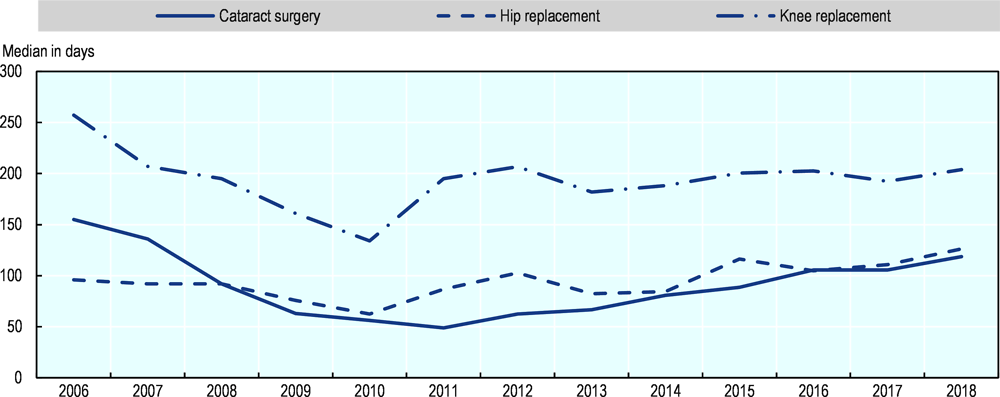
Estonia is a country where waiting times for elective strategy have traditionally been long. Between 2007 and 2014, a marked reduction in waiting times for cataract surgery and joint replacement was achieved, due at least partly to additional funding provided in some years to increase surgical activity rates. The waiting time guarantee for hip and knee replacement was also shortened from 2.5 years to 1.5 years at the beginning of 2013. However, since 2014, waiting times for these elective surgery have started to go up again, returning to their level of 2007 in the case of hip replacement or to even higher level in the case of knee replacement (Figure 4.14). In 2018, the Health Insurance Fund provided an additional EUR 34 million to improve the availability of specialist services and finance about 140 000 additional treatments. The goal was to reduce waiting times for cataract surgery and joint replacement. The number of these operations increased substantially over the previous years (Figure 4.15). This was accompanied by a reduction in waiting times for cataract surgery and hip replacement, but not for knee replacement.
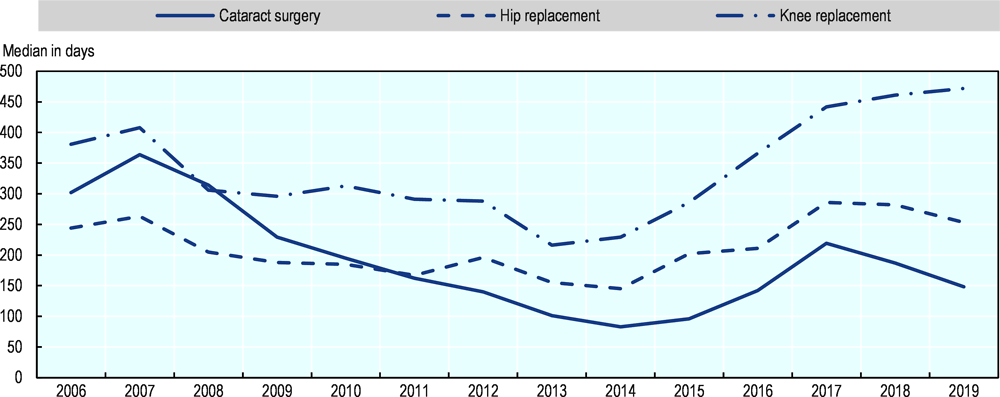
Source: OECD Health Statistics.
Source: OECD Health Statistics.
Poland has also taken steps to increase the supply of elective care to reduce waiting times. Waiting times for cataract surgery and joint replacement started to fall in 2018 (Figure 4.16) as the number of these surgical procedures increased substantially (Figure 4.17). Until 2018, if the demand for services exceeded what had been budgeted for, elective services were rationed through waiting lists with the services postponed to the next year. Since 2018, additional funding is provided for additional treatments, targeting a reduction in waiting times for cataract surgery, and hip and knee replacement. Information on waiting times for different treatments in public hospitals are now also more easily accessible to patients through a dedicated website. A growing number of Polish people also purchase a private health insurance to get quicker access to services in private hospitals.
Note: These data only relate to waiting times in public hospitals.
Source: OECD Health Statistics.
Source: OECD Health Statistics.
In Slovenia, additional financial resources in 2016-18 were earmarked to increase services with excessive waiting times. Moreover, some elective treatments with long waiting times were reimbursed without any maximum amount to boost supply. A pilot project in 2019 for joint replacement operations focussed on optimising internal processes at the organisational level to increase the volume of activities.
Waiting times for elective surgery in Costa Rica have been reduced in recent years, but they remain quite long, with waits averaging about one year in 2018 for a set of surgical procedures. A new 2019-20 National Plan is designed to reduce further these waiting times (Box 4.2).
The 2019-20 National Plan for the Timely Medical Attention of Patients in Waiting Lists in Costa Rica aims to further reduce waiting times for outpatient care and elective surgery, with the project “Timely Care Plan for People” targeting patients referred for the first time to specialised medical centres. The supply of elective surgery has been increased through evening surgery and improved operating room time, and consideration is also given to introducing evening consultations with specialists. To improve efficiency, special interregional and national projects have been launched, such as the Integrated Networks for the Provision of Health Services in collaboration with national and specialised hospitals, with patients being redirected to providers with available capacity. Specific initiatives target hip and knee replacement, and cataract surgery (e.g. through the Sight Care Plan introduced in 2017), also through networks of national and regional hospitals that have started to carry out evening surgery.
The supply-side policies covered in this section are consistent with past experience in different countries showing that, in general, temporary increases of dedicated funding will only have temporary effects, and are unlikely to be successful in achieving lasting reductions in waiting times (Siciliani, Borowitz and Moran, 2013[1]). Instead, as discussed above, they can be successful if increases in resources and activities are maintained over time and if they are linked with maximum waiting times targets or guarantees, so that there are consequences for providers if progress towards meeting the maximum waiting times has not been achieved.
4.1.4. Prioritising patients on the list can contribute to reducing waiting times or the burden from waiting across patients as shown in New Zealand, Norway and Australia
Several countries have implemented prioritisation policies as a demand-side intervention to improve the management of elective surgery. Prioritisation can take two forms. First, some countries (e.g. New Zealand) have introduced policies that manage the demand by prioritising patients with different clinical needs, with the aim of avoiding to add patients on the list when the expected benefits from treatment are small or almost nil. Second, other countries (e.g. Norway, Australia and New Zealand also) have improved the prioritisation of the waiting list by re-allocating waiting times across patients and ensuring that patients with more severe conditions wait less than those lower level of severity, or by establishing different maximum waiting times for different types of patients, though the approaches can be very different across these countries.
New Zealand is a prime example of a country that has tried to improve the prioritisation of patients, though over time this demand management policy has been complemented by supply-side interventions. Since 2000, New Zealand has a national strategy for reducing waiting times for elective (or planned) care, with some amendments made in 2012. The strategy has four main objectives: i) a maximum waiting time of 6 months for a first specialist assessment (reduced to 4 months in 2012); ii) all patients with a level of need which can be met within the resources (funding) available are provided with surgery within 6 months following specialist assessment (also reduced to 4 months in 2012); iii) the delivery of a volume of publicly-funded services which is sufficient to ensure timely access to elective surgery before patients reach a state of unreasonable distress, ill health and/or incapacity; and iv) national equity of access to elective care, so that patients have similar access regardless of where they live.
The New Zealand approach is original in terms of explicitly acknowledging that the level of needs which can be met depends on available resources, therefore putting emphasis on demand management and the development and implementation of consistent clinical assessment to reduce uncertainties in the duration of the wait for patients. Clinical assessment of needs has been facilitated through the development of clinical prioritisation assessment criteria (CPAC) tools, which are multi-dimensional and integrate both objective criteria and subjective assessment. However, there are also supply elements in the policy through increasing public hospital capacity and activities.
Following the reduction in waiting times for elective surgery to a maximum of 4 months in 2012, waiting times have declined for many common elective surgical procedures (Figure 4.18) and are well below OECD averages (Figure 2.3). This reduction has been achieved through a combination of demand-side interventions as well as supply-side measures. Figure 4.19 shows that while there has been some increases in the volumes of surgical activities since in 2012, this hasn’t been a sharp rise.
Source: OECD Health Statistics.
Source: OECD Health Statistics.
In 2019, the New Zealand Ministry of Health released the ‘Planned Care Strategic Approach 2019-2024’ to District Health Boards, which suggests a broader approach with a focus on the whole patient pathway, including also diagnostics tests. The plan is based on the principles of equity, quality, timeliness, access, and experience, and includes the following strategic priorities: balancing national consistency and local context, simplified pathways for service users, optimising sector capacity and capability, and being “fit for the future”. This Strategic Approach was launched in July 2019 and is in the process of being implemented across New Zealand.
Norway has introduced, since 2002, what can be described as an individual (patient-specific) maximum waiting time guarantee that is based on the patient health condition, need and severity. This policy is still in place today. All patients who have been given a right to hospital care (as well as specialised mental health services or specialised substance abuse treatments) are assigned an individual clinically assessed maximum waiting time. This policy was motivated by the concern that maximum waiting time guarantees may cause mis-prioritisation of patients (with more complex patients waiting longer) unless this was accompanied by a clinical prioritisation. In addition, all patients have free choice of providers, both among public and certain private providers. Information about expected waiting times is published on the website where patients receive information about provider choice. This can contribute to relieve pressures on providers with capacity issues while helping providers with available capacity to maximise the use of their resources. In 2018, 98% of all patients received health care within their individual maximum waiting time.
Australia also prioritises patients based on needs, but the system is based on a simpler classification than in Norway. It involves setting waiting times for patients based on three urgency categories: Category 1 – Admission within 30 days for a condition that has the potential to deteriorate quickly to the point that it may become an emergency; Category 2 – Admission within 90 days desirable for a condition causing some pain, dysfunction or disability but is not likely to deteriorate quickly or become an emergency; and Category 3 – Admission within 365 days for a condition causing minimal or no pain, dysfunction or disability, which is unlikely to deteriorate quickly and which does not have the potential to become an emergency.
4.1.5. Several countries seek to improve the coordination between primary and secondary care to reduce waiting times for specialist consultations
Several countries have emphasised the need for better coordination between primary and second care, to ensure that referrals from primary care are appropriate and addressed in a timely manner. In Poland, there are plans to strengthen the role of GPs to reduce the need for ambulatory specialist care, for example by GPs expanding their role for ophthalmology and dermatology consultations, but there is a recognition that this will require additional financial incentives. In Finland, there are plans to increase specialist consultations taking place in primary health care centres to reduce unnecessary referrals to hospital care, in particular for patient with chronic conditions. In Italy, a classification system called the Homogenous Waiting Times Group has been introduced to facilitate the coordination between primary and secondary care, and ensure that both GPs and specialists assess the need and urgency in the same way and agree on assigning different maximum waiting times based on urgency with common criteria. In Slovenia, the pilot project on "Better management of excessive waiting times" also refers to the need of fostering better cooperation between primary and secondary care for referrals. In Costa Rica, there are initiatives to strengthen the appropriateness of primary care referrals for specialist care, and to introduce protocols and prioritisation criteria for referrals and diagnostics.
In Canada, there is no national policy on specialist visits. However, teams of health care providers from various provinces have partnered with the Canadian Foundation for Healthcare Improvement (CFHI) to spread two innovations aimed at improving coordination between primary care providers and specialists. The two innovations were the Champlain BASE™eConsult Service, a secure web-based eConsult service originally launched in the province of Ontario and the Rapid Access to Consultative Expertise (RACE™), a telephone advice line originally launched at Providence Health Care and Vancouver Coastal Health in the province of Ontario and British Columbia. The two innovations resulted in 4 in 5 eConsults receiving a response from a specialist within 7 days. More than half (53%) of eConsults avoided any face-to-face referral to a specialist, while 40% of eConsults avoided an emergency department visit.
Digital consultations are becoming increasingly common since the COVID-19 pandemic to limit physical contacts, and a growing number of countries have either introduced or extended the possibilities of teleconsultations (OECD, 2020[34]).
4.2. Policies to reduce waiting times for primary care
In many OECD countries, primary care delivered by general practitioners (GPs) is the first level of contact for the population with the health care system. Timely access to high-quality primary care is crucial to improve health, reduce inequalities, and make the health system more efficient (OECD, 2020[35]). Half the countries that responded to the OECD questionnaire consider waiting times in primary care an issue (Figure 1.3).
4.2.1. Maximum waiting time targets in primary care generally range between 1 and 7 days
Some countries – primarily in Northern Europe but also some regions in Spain – have set maximum waiting times for primary care (Table 4.2). The Baltic countries (Estonia, Latvia and Lithuania) all require urgent patients to be seen within one day, while non-urgent cases should be seen within 5 to 7 days. Norway and Iceland require a consultation within 5 or 6 days, respectively2. In Spain, maximum waiting times are set at the regional level, and vary from 1 to 3 days in those regions that have set such a maximum. In Finland, all patients should be seen on the day when they contact a primary care centre and a further evaluation of their care needs (if needed) should take place within 3 days.
4.2.2. Supply-side policies focus on expanding the primary care workforce and extending opening hours
The number of (GPs) per population varies widely across OECD countries, although some of the variation is due to differences in the ways doctors are categorised across countries. For example, in the United States, general internal medicine doctors often play a role similar to that of GPs (family doctors) in other countries, yet they are categorised as specialists. On average across OECD countries, there were 0.77 GPs per 1 000 population in 2017 (or about 1 300 population for every GP), but this number was much lower in some countries (Figure 4.20). In most countries, the number of GPs as a share of all doctors has decreased over the past two decades.
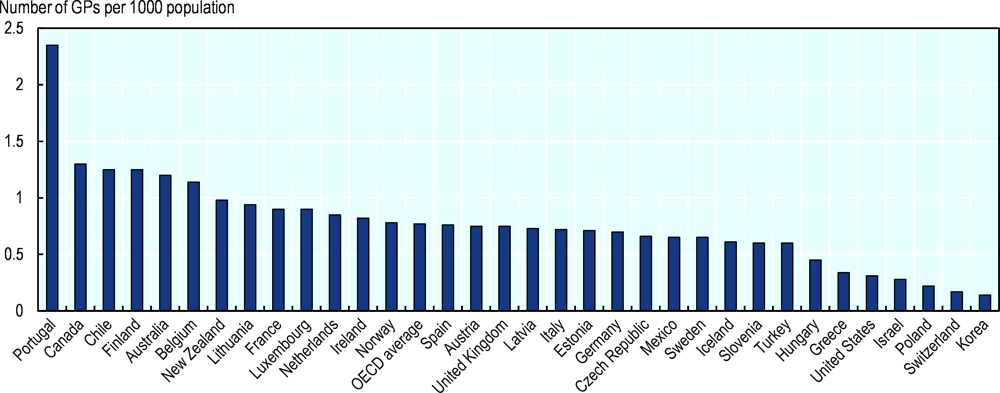
Note: The number of GPs in Portugal, Chile and Greece is over-estimated as it includes all doctors licensed to practice, not only those actually practising. In the United States and other countries, GPs do not include general internal medicine doctors (who are categorised as specialists) although they often play a role similar to that of GPs.
Source: OECD Health Statistics.
Several countries have taken initiatives to increase the availability of primary care physicians. In Norway, municipalities are working to recruit and retain GPs in response to increasing demand for services. Luxembourg has developed a specific training in general medical practice at the University of Luxembourg. Portugal has significantly increased the training of family doctors and the recruitment of physicians for the NHS primary care units in recent years. Costa Rica is increasing the number of EBAIS (Basic Teams for Comprehensive Health Care), which are located in communities across the country, as well as the number of specialists in Family Medicine, to reduce waiting times for primary care.
Lithuania has implemented the Family Medicine Development Action Plan for 2016-2025, which aims to increase the number of family doctors and ensure their adequate distribution – amongst other objectives. Lithuania also expanded the family doctor team with nurse assistants, social services workers, lifestyle medical specialists and physiotherapists. These professionals can provide effective, high-quality services while lowering the workload for GPs. In 2019, Lithuania expanded the clinical competencies of general practice nurses, allowing them to coordinate the tasks of nurse assistants, prescribe medicinal products in some situations, monitor the progression of chronic diseases, prescribe routine urine and blood tests, and interpret their results.
Many other countries have expanded the role of different primary care providers beyond GPs to improve timely access while maintaining a role of leaders for GPs in primary care teams. Many countries have reported that nurses or physician assistants can deliver a growing number of services in primary care, including providing immunisation, health education and routine checks of patients with chronic conditions (Table 4.3). For example, since 2010, family nurses in Estonia can give consultations and counselling to certain groups, including patients with chronic diseases, pregnant women and healthy neonates. Cooperation between solo practices in rural areas and the creation of group practices has also been incentivised by the government, to help cover holidays and unexpected sick leave.
In the United Kingdom, the 2019 GP five-year contract framework provides funding to 20 000 non-GP roles in general practice, including pharmacists, physician associates and first contact physiotherapists. These roles have been chosen as they can reduce GP workload (NHS, 2019[36]).
In many OECD countries, seeing a GP outside normal working hours is difficult for a substantial proportion of the population, often resulting in visits to hospital emergency departments. The survey on the quality and costs of primary care (QUALICOPC) carried out in 2013 showed that over 30% of the population in a dozen of countries reported then that it was too difficult to see a GP during evenings, nights and weekends (Figure 4.21). Many countries have taken steps to increase access to care outside of normal operating hours and in doing so reduce the waiting times for primary care.
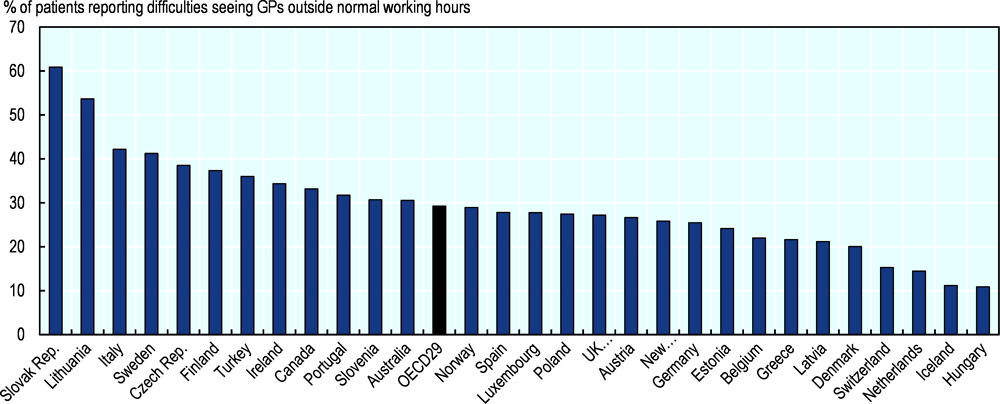
Source: OECD estimates based on QUALICOPC (2013).
A more recent survey led by the Commonwealth Fund found that the proportion of primary care practices that had arrangements in place for patients to be seen when they are closed exceeded 90% in Germany, New Zealand, Norway and the Netherlands in 2019, while less than half of primary care practices in the United States and Canada had these arrangements in place (Figure 4.22).
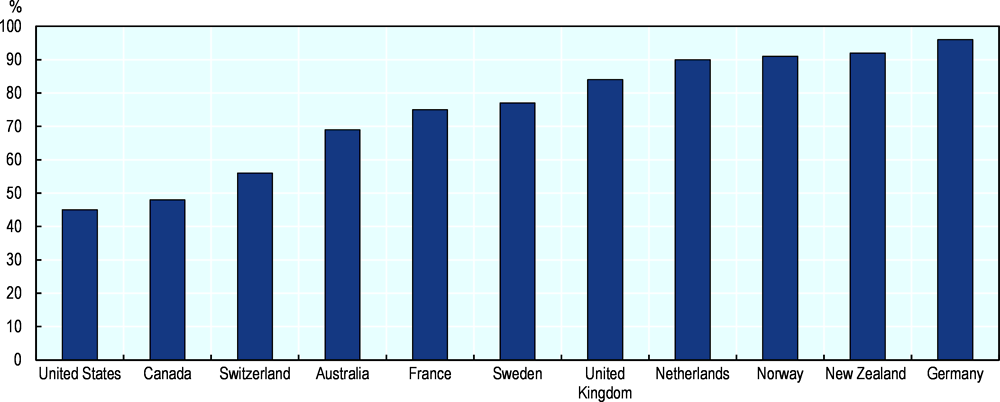
Source: 2019 Commonwealth Fund International Health Policy Survey of Primary Care Physicians.
Australia has financial incentives for primary care practices to provide timely care, under the Practice Incentive Program (PIP). The PIP After Hours Incentive encourages practices to provide patients with access to quality after-hours GP care. In Luxembourg, the Ministry of Health funds “Maisons Médicale de garde” (medical on-call centres) to provide out-of-hours primary care.
4.2.1. New technologies are used to increase access and reduce waiting times on both the demand and supply side
While the use of telemedicine in OECD countries was quite limited before the COVID-19 crisis (Oliveira Hashiguchi, 2020[38]), some countries had already turned to new technologies to increase the supply of primary care services. Australia had already developed new payment models to fund the provision of teleconsultations, and access to teleconsultations have been accelerated and broadened in March 2020 to reduce the spread of COVID-19. Since 2013, teleconsultations have also been covered under the Estonian Health Insurance Fund, as well as e-referrals to improve coordination between primary and secondary care. These teleconsultations are likely to become even more prominent in the future, in particular for the elderly and people with chronic conditions to reduce their risk of catching serious infectious diseases like COVID-19 (OECD, 2020[34]).
Digital technology has also been used to address the demand side of waiting times. Luxembourg has developed a mobile phone app called “DispoDoc” in collaboration with the e-Health Agency and the Society of General Practitioners. The app shows the GP practices that are open in the immediate surroundings of the patient, including outside of usual opening hours. In Mexico, some institutions are using appointment scheduling via internet that takes into account the number of doctors available in the different departments, to minimise the waiting times. Australians can access health information and advice via Health Direct, a free 24 hour help line. It is staffed by registered nurses who provide a triage service and access to an after-hours GP helpline. In areas where there are no GPs, Health Direct provides a call-back service from a GP who can provide advice over the phone.
4.3. Policies to reduce waiting times for cancer care
Waiting times for cancer care is considered to be an issue in the majority of OECD countries (Figure 1.3), but not in some countries like the Czech Republic, Iceland, Ireland, Israel, Japan, the Netherlands and Slovenia. However, in some of the countries where waiting time is not considered to be an issue, waiting times for cancer care are relatively long. For example, in Iceland, about 20% of patients in early 2019 had been waiting for more than 3 months for a breast cancer surgery.
In Canada and the United Kingdom, waiting time strategies have been developed to reduce waiting times for cancer care as part of broader waiting time policies. In Canada, federal, provincial and territorial governments committed in 2004 to reduce waiting times in cancer care and to improve waiting time data reporting. The United Kingdom involves a wide range of stakeholders (including health professional bodies and patient groups) in developing operational standards for waiting times in cancer care.
Several OECD countries (e.g. Denmark, Ireland, Latvia, Lithuania and New Zealand) aim to ensure timely access to cancer care under the national cancer control programme. For example, Lithuania has introduced a National Cancer Prevention and Control Programme for the period 2014-2025, with one of the main objectives being to improve timely access to diagnostic services and treatment for cancer patients. The New Zealand Government is developing a ten-year Cancer Action Plan for the period 2019-2029, which will aim to improve services across all cancer control activities including waiting times for diagnosis and treatment.
4.3.1. To tackle long waiting times in cancer care, the majority of OECD countries set waiting time targets and regularly evaluate the progress
OECD countries have implemented a range of policy measures to tackle waiting times for cancer care, including: 1) the introduction of maximum waiting time targets; 2) the regular evaluation and assessment of waiting times; 3) the introduction of fast track pathway; 4) the provision of financial support to increase the capacity and delivery of cancer care; and 5) a reorganisation of cancer care delivery and efforts to improve care coordination. About half of OECD countries set waiting time targets, which is accompanied by regular monitoring of progress in meeting these waiting time targets (Table 4.4).
4.3.2. Maximum waiting time targets for cancer care
Many OECD countries set maximum waiting times for cancer care that vary according to services and clinical assessment of urgency of diagnosis and treatment (Table 4.5).
There are variations in maximum waiting times for the same service across countries. For instance, while Hungary set waiting time targets of 2 weeks for CT and MRI scan in suspected cases of cancer, the maximum waiting time set for such diagnostic tests in Lithuania is two-times longer (4 weeks). In Estonia, the maximum waiting time for specialist care is 8 months for all patients including cancer patients.
4.3.3. Regular evaluation and assessment of waiting times for cancer care
In all OECD countries where waiting time targets for cancer care have been developed, waiting times are regularly monitored and assessed (Table 4.5). For instance, Denmark established integrated patient pathways for cancer patients and monitors pathway of cancer patients from whether they are examined and/or treated within recommended time periods. These data are monitored quarterly and annually and disaggregated by cancer and region. In 2015, Norway introduced standardised patient pathways covering diagnosis, treatment and rehabilitation for different cancers, and monitors whether targets are achieved within patient pathways specific to 26 cancers every four months and annually. In Iceland, the number of people on the waiting lists and the percentage of people waiting more than three months among all the people on the waiting lists are reported every three months by hospital or clinic for specific procedures related to cancer care. Latvia also monitors and reports each year waiting times for certain cancer care, such as colonoscopy, mammography, chemotherapy and radiation therapy in day care, and oncologist by medical institution.
Greece and Mexico are the only two countries that consider waiting times to be an issue for cancer care, but have not yet conducted any regular monitoring and assessment.
Regular monitoring of waiting times for cancer care has been accompanied by progress in reducing waiting times in some countries, but progress in other countries has been mixed or limited. In Estonia, for example, the average number of days that patients wait to get an appointment with an oncologist has been cut down by nearly half between 2008 and 2018 (from 15 days to 8 days), yet the proportion of patients who had to wait at least 6 weeks to get a consultation with an oncologist has increased in recent years, indicating that many patients are waiting longer.
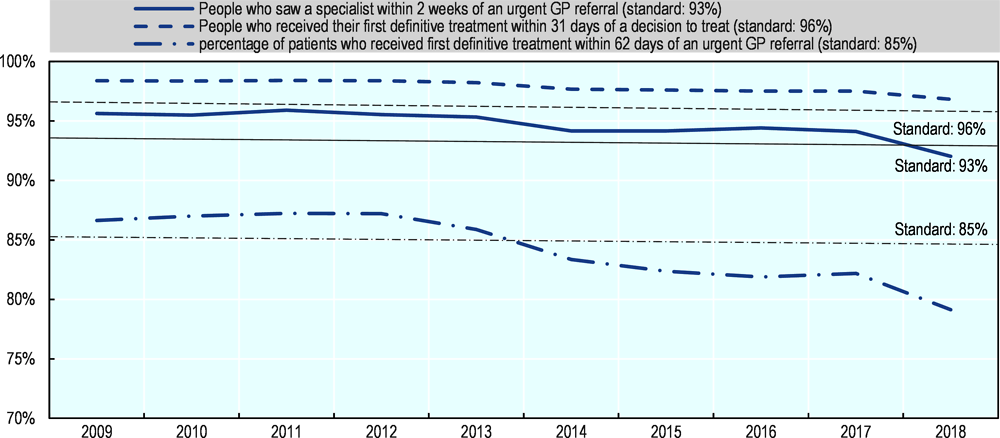
In many OECD countries, waiting times for cancer care have been stable over time and in some cases such as in Canada, Ireland, Spain (Aragon) and the United Kingdom, meeting maximum waiting time targets for some cancer services have become more difficult in recent years (Figure 4.23). In the United Kingdom, while the proportion of patients who receive their first treatment within 31 days of a decision to treat has remained stable and above the standard (or target) of 96% in recent years, the proportion of patients who receive their first treatment within 62 days of an urgent GP referral has fallen below the standard of 85% to 79% in 2018. This is partly because the proportion of people who saw a specialist within 2 weeks of an urgent GP referral also fell below the standard of 93% (Figure 4.24).
Source: OECD Waiting Time Data Questionnaire 2019.
Source: OECD Waiting Time Data Questionnaire 2019.
4.3.4. Fast track pathway for cancer patients
Many countries (e.g. Denmark, Ireland, Latvia, Poland, Slovenia and some regions in Spain) introduced a fast track to diagnose and treat cancer patients. In Poland, for example, under the Rapid Oncology Therapy package introduced in 2015, if suspected cancer is confirmed, a doctor issues a Cancer Diagnosis and Treatment Card (DiLO Card), which allows fast track treatment. Latvia also introduced fast track access for cancer patients (called Green Corridor/Tunnel) in 2016. The proportion of cancer patients diagnosed at early stages has increased from 50% in 2015 to 55% in 2017. The longest waiting time for a mammography, chemotherapy and radiation therapy has also decreased by 4 days, 54 days and 10 days respectively between 2015 and 2019 (to reach 28 days, 42 days and 32 days). However, during the same period, the longest waiting time has increased to get a colonoscopy from 82 to 144 days. Although the average waiting times to get an appointment with an oncologist across has decreased between 2013 and 2019, waiting times in some institutions are still very long (Figure 4.25).
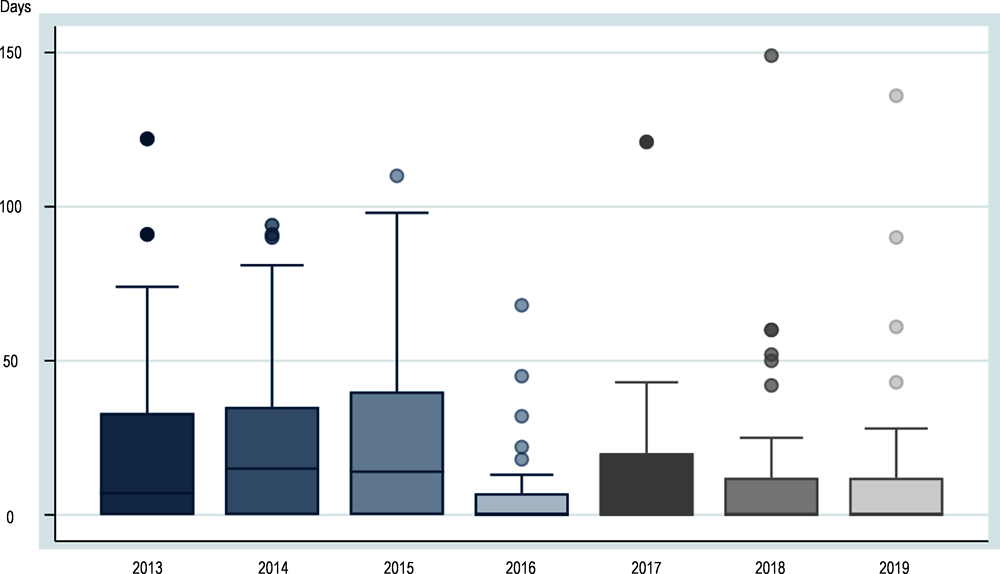
Note: Data refer to the waiting time for oncologist in each medical institution with an oncologist during the month of February. The box shows up to the 75th percentiles while the bar in the box refers to the median. The H shows an upper value (75th percentile plus 1.5 times the difference between the 75th percentile and 25th percentile) while the dots show the outliers.
Source: OECD Waiting Time Data Questionnaire 2019.
4.3.5. Financial support to increase capacity and delivery for cancer care
Several OECD countries have increased funding to expand the capacity to deliver cancer care more rapidly. This has been the case notably in several Central and Eastern European countries (Hungary, Latvia, Poland and Slovenia) where the resources allocated to cancer care were historically more limited. Poland provides financial support to realise timely provision of cancer care under the Rapid Oncology Therapy package. Similarly, in Latvia, services provided under the Green Corridor/Tunnel (fast track) have been financed fully by the state budget.
In Australia, the variation in access to radiotherapy across states as well as between rural and urban areas has been addressed through regular additional investment in equipment and trained staff to deal with insufficient resources, with success in reducing such geographic inequality (OECD, 2013[39]).
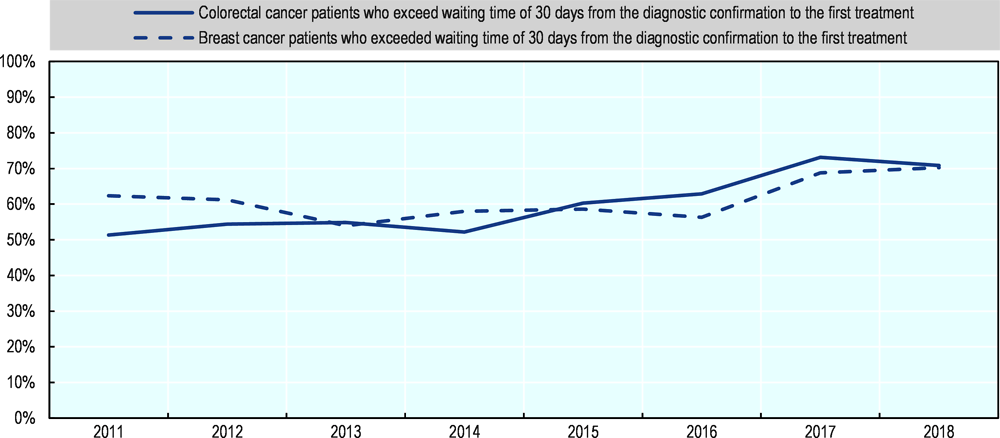
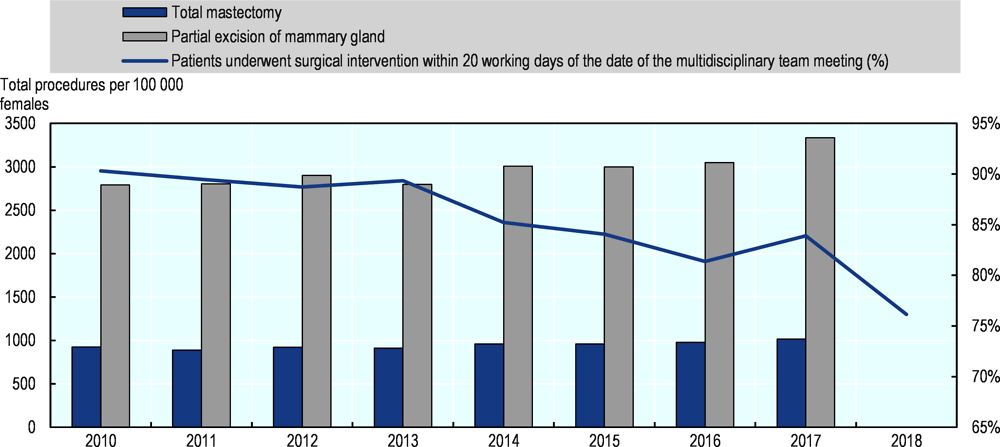
However, as is the case for other elective treatment, increasing the supply of resources and treatments for different types of cancer provides no guarantee that waiting times will fall if the demand also increases. In Ireland, for instance, breast cancer surgery has increased between 2010 and 2018, particularly the number of total mastectomy which has grown by nearly 20%. Nonetheless, during this period, the proportion of patients who underwent surgical intervention within 20 working days of the date of multidisciplinary team meeting has decreased from 90% to 76% (Figure 4.26).
Source: OECD Health Statistics 2019 and OECD Waiting Time Data Questionnaire 2019.
4.3.6. Reorganisation of cancer care delivery and promotion of greater care coordination
Some OECD countries (e.g. Finland and Luxembourg) have undertaken a reorganisation of cancer care delivery to improve the quality of cancer care and reduce waiting times. In order to resolve waiting times for diagnosis of cancer, since 2016 Luxembourg has conducted a comprehensive reorganisation of National Health Laboratory’s diagnostic services by reducing outsourcing to laboratories abroad and fully operationalising the management of these services in the main hospitals. This reorganisation has resulted in eliminating waiting times longer than 14 working days for such diagnosis.
In 2016, the Ministry of Social Affairs and Health in Finland announced the establishment of a new National Cancer Centre, with a responsibility to ensure equal and timely access to cancer care and promote quality of care. It started its activities in 2018.
Norway has also launched a number of initiatives in recent years to improve access and quality of cancer care. Cancer patient pathways were introduced in 2015 for 28 different types of cancer to reduce unnecessary waiting times and improve coordination of care. Throughout the course of treatment and in the follow-up period the patient is assigned a designated pathway coordinator responsible for ensuring continuity of care.
In Slovenia, the coordination between professionals were strengthened with the introduction of a breast cancer screening programme and immediate access has been pursued for patients diagnosed through the programme, leading to a reduction of referral time in the 2000s. The colorectal cancer screening programme, introduced in 2009, also aims to shorten waiting times between screening and diagnostic colonoscopy and between colonoscopy and first treatment. In Italy, in some regions, particularly in the north, a disease management programme has introduced a scheduled follow-up, providing timely cancer care through organised care coordination. Denmark introduced National Integrated Pathways in 2007 to reduce delays, and implemented them for all cancer diagnosis in 2008 (OECD, 2013[39]).
4.4. Policies to reduce waiting times for mental health care
In OECD countries, between one in five and one in six people are living with a mental illness at any time (OECD/European Union, 2018[40]). Timely access to services can help people recover from a mental illness, or help them to manage the symptoms and reduce the impact on their lives. At least ten OECD countries have maximum waiting times targets for mental health services.
4.4.1. Many OECD countries have set maximum waiting times targets for mental health services for adults
Waiting times targets in the area of mental health services are reported in at least ten OECD countries. Denmark, Finland, Ireland, Lithuania, the Netherlands, New Zealand, Norway, some regions in Spain (including Baleares, Navarra), Sweden and the United Kingdom (England, Wales, Scotland) have a waiting times target or guarantee in at least one area of mental health care (Table 4.6).3 Most waiting times targets or guarantees aim to provide treatment or a first service contact within 1-3 months.
Since 2019, Norway has introduced standardised patient pathways within mental health services, and maximum waiting times between different points along the patient pathway have been set. Australia will track waiting times in youth mental health centres. In Canada, waiting times for mental health services are recorded at the provincial or territorial level, and efforts to introduce a national collection of waiting time indicators are ongoing.
4.4.2. Service- or condition-specific waiting times tracking or targets may offer more insights into levels of demand and access
Mental health care comprises a multitude of different conditions, severities, and service types. Some countries, for example Ireland, the Netherlands, Denmark and Finland, appear to track waiting times for all mental health care from the point of referral. Other countries, for example England, distinguish between different types of services, while the Netherlands records waiting times by category of disorder diagnosis. In the Netherlands, the average waiting time until the start of treatment varies from 12 weeks for schizophrenia and other psychotic disorders, to 18 weeks for personality disorders, while the target for waiting time is 14 weeks for all disorders (Nederlandse Zorgautoriteit, 2018[41]). In Norway, different waiting time targets are set for specialist mental health care, and specialist addiction care, while New Zealand also tracks waiting times for addiction care separately from mental health services.
For some conditions, a short waiting time can improve the therapeutic efficacy of services. Some countries have linked their waiting times targets to clinical guidelines for services or conditions, or assessments have been made of clinically acceptable wait times. There does not appear to be significant consistency between countries in terms of the waiting times targets they set, and only one country (England) distinguishes between targets set for different specialist mental health services. While it is understood that countries excluded patients needing urgent and emergency care from waiting lists, only one country (Norway) appears to differentiate waiting time target according to the individual patient’s needs.
The Canadian Psychiatric Association prepared a series of waiting time benchmarks for serious psychiatric illness, published in 2006, with wait indications ranging from 2 weeks (for urgent care or first episode psychosis) to 4 weeks (for depression, and other diagnostic and management consultations) (Canadian Psychiatric Association, 2006[42]).
In England, two waiting time standards for mental health services were introduced from 2015 (NHS England, 2015[43]). The two standards with waiting times targets are for Early Intervention in Psychosis (2 weeks from referral to treatment), and access to England’s psychological therapies programme (75% of people with common mental health conditions treated within 6 weeks, 95% within 18 weeks). These standards also assess ‘NICE concordance’, which is the degree to which the treatment delivered at the target time meets standards for clinical best practice. All waiting times standards are established in line with evidence from England’s NICE standards for evidence-based care. For example, access to Early Intervention in Psychosis services can reduce the likelihood of an individual receiving compulsory treatment from 44% to 23% during the first two months of psychosis (which is also cost saving), and reduce a young person’s suicide risk from 15% to 1% (NHS England, 2015[43]; NICE, 2014[44]). For this care, timely access to appropriate services can significantly improve outcomes in the long term (NHS England, 2015[43]).
4.4.3. Several OECD countries have waiting times guarantees or targets for children and adolescents
Several countries (Finland, Ireland, New Zealand, Norway, Sweden, Scotland, Wales) report separate waiting times guarantees for mental health services for children and adolescents. Waiting time targets appear to be similar, or slightly shorter, for children and young people. For example, in Norway, the target for children and young people (40 days) is slightly shorter than for adults (45 days). In Sweden, the wait time target is much shorter for children and young people (30 days) than for adults (90 days).
New Zealand has a wait time target for children and young peoples’ mental health services, but not for adult services (although wait times data is collected for adult services). Australia will start collecting waiting times information for children and adolescents, but does not do so for adults. In Australia, the “headspace” programme (a programme created in 2006 to support young people aged from 12 to 25 years to reduce the impact of depression, anxiety, stress, and alcohol and drug use) is the preferred model of youth mental health service delivery, and will be required to collect data and undertake research and analysis to regularly report on wait times across the headspace network.
In Ontario, Canada, long and growing mental health wait lists for children and adolescents are seen as a signal that mental health care availability was insufficient (Global News Canada, 2020[45]; Ipsos, 2020[46]). Between 2017 and 2020 the number of children and youth on waiting lists for mental health services doubled, from 12 000 to 28 000, with an average wait for care 67-92 days depending on the service, but the longest waits reaching 919 days or 2.5 years (Children’s Mental Health Ontario, 2020[47]).
4.4.4. Maximum waiting times targets or guarantees are met for a growing proportion of people in some countries
Where data is available over time, the proportion of patients who have been assessed or treated within the maximum waiting times targets appears to have increased in many countries and average waiting times decreased for mental health care. While data is not comparable between countries as they cover different types of mental health services and maximum waiting times for these services, some countries submitted time series data for adult mental health services (Denmark, Estonia, Finland, Norway), and time series data could be found for England. Based on these data, the proportion of persons meeting the waiting time target appears to have been stable or increasing over the past five years in most countries. In Denmark, the proportion of patients assessed and investigated within 30 days increased from 91% in 2016 to 94% in 2017 and 2018. In Finland, the proportion of patients who waited less than 90 days increased from 85% in 2012, to 93% in 2018, with a brief drop to 88% in 2017. However, in Estonia, the percentage of patients who had a consultation with a specialist within 6 weeks was at 78% in 2013-15, then dropped to 73% in 2017 and again to 68% in 2018 (Figure 4.27).
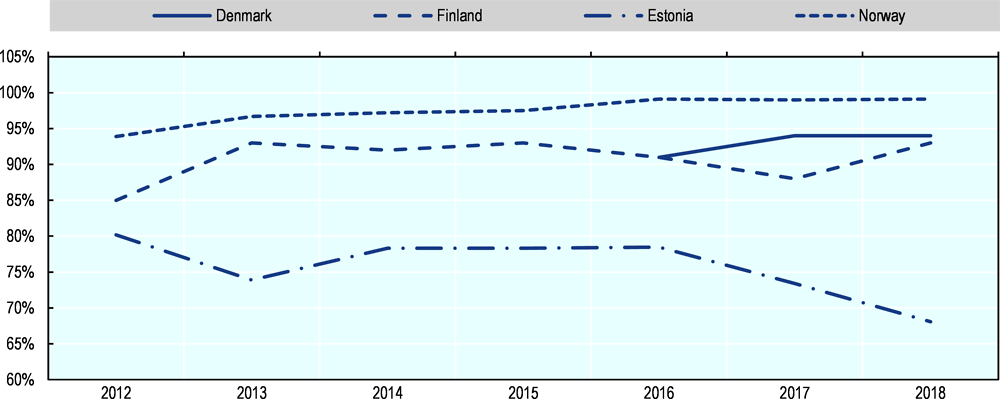
Note: Data show the percentage of persons who meet nationally-set wait times target for mental health services. The data are not comparable across countries because they cover different mental health services and waiting time targets for these services. National wait times shown are as follows: Denmark (persons assessed and investigated within 30 days); Finland (patients waiting less than 90 days before receiving psychiatric care following special assessment); Estonia (percentage of patients who had a consultation with a specialist within 6 weeks); Norway (percentage of patients who have received health care within the clinically assessed deadline assigned to the patient);.
Source: OECD Waiting Times Data Questionnaire 2019.
When looking at a broader measure of the average waiting times for all patients, there also appears to have been progress in reducing waiting times in these countries. Mean wait from referral to the start of treatment fell from 35 days in 2014 to 21 days in 2018 in Denmark; and from 52 days in 2014 to 45 days in 2018 in Norway. In Norway, average waiting time for adults fell by 2 days between 2018 and 2019, and 11 days between 2013 and 2019 (Helsedirektoratets Norway, 2019[48]). On the other hand, the mean waiting time to get a consultation with a mental health specialist rose slightly from 28 days in 2015 to 31 days in 2018 in Poland.
National aggregates can also mask variations by age group and region. For example in New Zealand, 91% of people under 19, 94% of working age adults (19 – 64) and 96% of older adults were seen by a mental health provider in under 8 weeks, a national total of 93% in 2017-18 (National Services Framework Library, 2019[49]). While in most regions more than 90% of people were seen by mental health services in less than 8 weeks, in the Southern region 87% of people had been seen. Another outlier stood out in the Taranaki region, where 23% of under 19 years olds waited longer than 8 weeks in 2017-18, more than twice the national average of 9%. However, it is not clear based on this analysis whether tracking wait times or introducing wait time targets in itself contributes to stabilised or falling average waits for mental health services. It may be that wait time tracking or targets are introduced in priority areas where other policy measures or investments are contributing to improving overall access.
It is important to pay attention not just to the proportion of people who were able to access care within a set waiting time target, but also to the range of wait times for services. For example, a majority of people may receive care within a certain number of weeks, but if a small number of people are still waiting two or three times longer to access care, this can point to areas of weakness in service provision.
4.4.5. Supply-side policies appear to be the most common tool for reducing mental health waiting times
Although policy discussions are not always framed in terms of reducing mental health wait times, or meeting maximum wait time targets, policies appear to be focused on better meeting demand through increased service volumes or scope, rather than managing demand. A primary driver for waiting times targets is to increase overall access to mental health services, linked to a broader recognition that a significant treatment gap exists in the area of mental health (OECD, 2014[50]; OECD/European Union, 2018[40]). Countries also identify shorter wait times for accessing services as a way to reduce the risk of deterioration in health, and improve outcomes from treatment (Helsedirektoratets Norway, 2019[48]; NHS England, 2015[43]).
For example, when England introduced maximum wait time targets for mental health services, this included an injection of funding of GBP 80 million to increase service capacity. This included GBP 40 million of recurrent funding to support increased capacity in order to meet the 2 week wait time target for early access to psychosis services. GBP 10 million was provided as implementation funding for psychological therapies services, which was to be used to confirm the accuracy of existing waiting lists, and enhance capacity to provide assessment and treatment (NHS England, 2015[43]).
In Australia, the 2019-20 health budget includes a priority focus on mental health. As part of this budget the Government will expand the ‘headspace’ service network, which provides care for young people, to improve access to services and reduce wait for services. A previous report had detailed that youth mental health services were coming under increasing demand for services, and that waiting times were a concern in almost 90% of youth mental health ‘headspace’ centres (headspace, 2019[51]). Under the 2019-20 budget, AUD 111.3 million (about USD 76 million) will be invested by 2021 to introduce 30 new centres or satellite centres, and AUD 152 million to help headspace centres experiencing high levels of demand (Australian Government Department of Health, 2019[52]). Waiting times will be tracked in headspace centres, which will be a tool to assess responsiveness to demand as well as the impact of additional funding.
In countries where waiting times are common across health services, introducing waiting times for mental health services can be part of a broader drive to create ‘parity of esteem’ between mental health care and the rest of the health care system, for example in England (NHS, 2019[53]). In Sweden and Denmark it appears that maximum waiting times targets for mental health are set to the same level as wait times for specialist services more broadly.
Based on information reported to the OECD, only Denmark has built in ‘sanctions’ in instances where maximum waiting time targets are not met. In Denmark extended free hospital choice means people have the right to receive examination or treatment in a private hospital if you have to wait more than 30 days.
Notes
← 1. In April 2019, patients had been waiting for elective care in hospitals for approximately 1-2 months, with those waiting between 3 and 6 months accounting for 13% of all patients. However, their number has increased from the previous year (by 1 400 people).
← 2. It may be assumed that where not otherwise specified, these waiting times are for non-urgent cases.
← 3. In its response to the OECD Policy questionnaire in September 2019, the Slovak Republic also indicated that it was in the process of drafting a legislation on maximum waiting times for specific treatments, including possibly for mental health services, while Poland tracks waiting times data.