
3. Are LGBTI+ Americans discriminated against?
This chapter explores whether LGBTI+ Americans benefit from a level playing field. It begins by examining the degree of social acceptance towards LGBTI+ Americans and their perception of discrimination. The chapter then assesses their economic situation before focusing on their labour market outcomes. The analysis concludes by delving into their health and well-being status. This investigation underscores the persistent disparities faced by LGBTI+ Americans. While social acceptance towards them has increased, perceptions of discrimination remain prevalent. After adjusting for demographics, LGBTI+ Americans consistently have lower household income, which reflects the significant challenges they face in the labour market, both in terms of employment and labour earnings. These disparities, at least partly driven by societal stigmatisation, are also manifest in substantial health and well-being gaps for LGBTI+ Americans.
Chapter 3 provides a thorough evaluation of equality for LGBTI+ Americans. It begins by exploring the levels and trends of social acceptance towards LGBTI+ Americans and their perception of discrimination. The chapter then investigates the economic situation of LGBTI+ Americans, before zooming in on their labour market outcomes. The chapter concludes by analysing their health and well-being status.
Although social acceptance towards LGBTI+ Americans has been increasing, their perception of discrimination remains prevalent.
The United States has witnessed a notable shift towards greater acceptance of homosexuality, but this has not been as widespread for other sexual orientations and non-cisgender identities.
The share of US adults supporting same-sex marriage has moved from a minority (42%) in 2004 to a majority (71%) in 2023, even among traditionally more conservative demographic groups.
Attitudes towards other sexual orientations such as bisexuality or asexuality remain negative.
Similarly, acceptance of gender diversity lags behind: only a minority of Americans (43%) consider changing one’s gender to be morally acceptable in 2023, down from 46% in 2021.
The perception of discrimination continues to be widespread among LGBTI+ Americans, leading to concealment strategies that are detrimental to their lived experiences.
LGBTI+ Americans report nearly double the rate of discrimination in the year preceding their interview, at 36%, compared to 19% for non-LGBTI+ respondents.
More than three-quarters of LGBTI+ Americans, including 90% of non-cisgender individuals, report taking at least one concealment action to avoid experiencing discrimination.
Concealing one’s identity does not prevent hampered life trajectories. For instance, closeted LGBTI+ employees are likely to still face poor career prospects as they might avoid networking and professional development opportunities. Moreover, the fear of unintended disclosure can lead to significant stress and anxiety, impacting their productivity at work.
LGBTI+ Americans have lower household income.
Even after adjusting for demographics, LGBTI+ adults earn an annual household income that is 8% lower than that of cisgender straight adults, noting that this disparity was exacerbated at the onset of the COVID-19 pandemic.
Regardless of the sex assigned at birth, the income penalty is more pronounced for non-cisgender individuals (11%) than for cisgender LGB+ adults (7%). Within the cisgender LGB+ group, the income disparity is not statistically significant for gay men and lesbians. However, it is larger and statistically significant for bisexual men and women (8.5%). The largest disparity is observed among cisgender individuals with other non-heterosexual orientations (16.5%).
The income penalty for LGBTI+ individuals diminishes with age, possibly due to a non-disclosure bias. Mature adults from disadvantaged backgrounds might be less inclined to “come out”, even in surveys. Among young adults aged 18-34, all LGBTI+ subgroups face a notable income penalty, with the exception of cisgender gay men.
Lower household income for LGBTI+ individuals partly reflects the greater challenges they face in the labour market.
Both laboratory and field experiments conducted in the United States have revealed prevalent discrimination against LGBTI+ job candidates. Concurrently, extensive research using representative survey data has confirmed that either direct discrimination or the fear of such discrimination – which leads to the adoption of detrimental coping strategies – negatively impacts the labour market paths of LGBTI+ individuals.
We confirm that LGBTI+ Americans face substantial unexplained labour market gaps, focusing on working-age adults living alone. Restricting the analysis to adults living alone yields more accurate estimates of labour market disparities by sexual orientation and gender identity. This approach effectively neutralises the bias resulting from the lower household specialisation observed in same-sex partnerships relative to different-sex partnerships. If this bias is not addressed, it leads to overestimating the penalty for LGBTI+ men, and to underestimating this penalty for LGBTI+ women.
LGBTI+ Americans have a 7% unexplained lower likelihood of employment and are 24% more likely to experience job loss, compared to their cisgender straight peers. These disparities exist across all LGBTI+ subgroups and became even more pronounced during the COVID-19 pandemic, largely due to LGBTI+ individuals working in industries hard hit by the pandemic, such as restaurants, food services or art and entertainment.
Accounting for differences in demographics, sectors, and occupations, LGBTI+ workers have labour earnings that are 7% lower than those of their straight cisgender counterparts. It is crucial to stress that by adjusting for the tendency of LGBTI+ individuals to select certain sectors and occupations to evade discrimination, we underestimate the true labour earnings penalty caused by discrimination or the fear of it. Indeed, our data show that this avoidance strategy ultimately results in LGBTI+ individuals taking lower-paying jobs. Without considering the impact of sectoral and occupational sorting, the labour earnings penalty for LGBTI+ individuals would reach 10%.
The labour earnings penalty for LGBTI+ individuals hides both reduced hours worked and reduced hourly wages.
Regardless of the sex assigned at birth, these labour market penalties are stronger for non-cisgender individuals than for cisgender LGB+ individuals.
In line with results on household income disparities, unexplained labour market gaps between LGBTI+ and non-LGBTI+ Americans decrease with age, except for the employment penalty for LGBTI+ women which increases as they get older. This phenomenon could reflect a combination of sexism, ageism, and homophobia, especially given evidence of strong age discrimination against female job candidates in the United States.
LGBTI+ Americans suffer from substantial health and well-being gaps.
Extensive research has documented widespread health and well-being disparities within the LGBTI+ population that flow from societal stigmatisation, discrimination from health practitioners, and economic vulnerability.
Even after adjusting for demographics, LGBTI+ Americans show a 50% higher risk of generalised anxiety or major depressive disorder than their cisgender straight peers. In line with prior research, this mental health penalty was most pronounced among non-cisgender individuals. Their risk is 87% higher than that of cisgender straight American adults, largely due to the greater health challenges faced by transgender individuals.
The mental health penalty does not differ based on sex assigned at birth. Additionally, the previously observed trend, in which the disparities for LGBTI+ individuals diminish with age, is consistent in the context of mental health. Finally, while, before the pandemic, LGBT adults were already 4% less likely to report enjoyment and 31% and 24% more likely to feel worry and stress, respectively, compared to their non-LGBT peers, all three gaps deteriorated with the onset of the COVID-19 crisis.
Relying on the Gallup National Health and Well-Being Index which was computed between 2014 and 2017, LGBT adults had a 7% lower overall well-being score. Notably, the financial (11%) and health (7%) penalties of LGBT adults emerged as major contributors to their reduced well-being.
3.2.1. Social acceptance of LGBTI+ Americans
The shift towards greater acceptance of homosexuality, in OECD countries and beyond, has been well documented (OECD, 2019[1]; Flores, 2021[2]), and the United States is no exception. Over the past two decades, the share of US adults who support same-sex marriage has moved from a minority (42%) in 2004 to a majority (71%) in 2023 (Figure 3.1). It is worth noting that this upward trend applies to all demographic subgroups, whether the analysis is performed by gender, age, race/ethnicity, educational attainment, region or political affiliation (Annex Figure 3.A.1). Consistent with previous studies (Valfort, 2017[3]) and with key findings from Chapter 2, attitudes towards homosexuality are less positive among men, older individuals, non-Whites, the less educated, those residing in the South, and supporters of the Republican Party. However, even among these subgroups, the share of individuals who support same-sex marriage has steadily increased. Remarkably, in all these segments, a majority are now in favour of marriages between same-sex couples being recognised by the law as valid, with the same rights as traditional marriages. That said, increasing acceptance of homosexuality may conceal significant disparities, particularly when considering the gender of the homosexual population considered. A survey conducted in the United States and 22 other countries, representing both Western and non-Western societies, revealed a consistent pattern: gay men are disliked more than lesbians across all surveyed countries (Bettinsoli, Suppes and Napier, 2020[4]). This pattern is primarily driven by male respondents. Men’s acceptance of lesbians is comparable to women’s acceptance of both lesbians and gay men, but men exhibit more negative attitudes towards gay men.
Although a significant share of individuals now supports homosexuality, even among traditionally less accepting groups, this degree of acceptance may not extend to other sexual orientations. Research has shown that bisexual individuals face unique stressors due to negative perceptions of non-monosexuality, occurring both within and outside of the LGBTI+ population (Doan Van et al., 2019[5]; Dyar and Feinstein, 2018[6]; Dodge et al., 2016[7]; Pew Research Center, 2013[8]; Herek et al., 2010[9]). Bias against asexual individuals has also proven to be substantial, with prejudice against them being more pronounced than prejudice against homosexuals or bisexuals (Hoffarth et al., 2016[10]; MacInnis and Hodson, 2012[11]). Prejudice against both bisexual and asexual individuals is rooted in monosexism, which is the pervasive belief that attraction to only one gender is both normal and superior to any other pattern of attraction, whether it be to more than one gender or to none at all.
Non-cisgender individuals face lower social acceptance than do homosexual individuals. According to the 2023 round of the Gallup Poll Social Series, only a minority of US adults support transgender individuals (Figure 3.2). Notably, less than half of respondents (43%) considered changing one’s gender to be morally acceptable. Alternative sources, although not based on probability sampling strictly speaking, paint a similar picture: 44% of US adults interviewed as part of the 2022 Economist/YouGov Poll agreed with the statement that “Someone can be a man or a woman even if that is different from the sex they were assigned at birth”.1 As with attitudes towards homosexuality, support for transgender individuals is greater among women, younger individuals, Whites, the better educated, residents in non-Southern states, and democrats (Annex Figure 3.A.2). In addition, hostility against non-binary individuals is stronger than anti-LGBT sentiment, and strongest among men (Coffman, Coffman and Marzilli, 2024[12]). Although there is no empirical research on social awareness and acceptance of people with intersex variations, recent studies have found widespread reports of stigma among this group, a phenomenon that is not limited to healthcare settings (Hegarty and Smith, 2023[13]).
Attitudes towards non-cisgender individuals are not only more negative, they have also deteriorated over the recent past. Representation of transgender and other non-cisgender identities has increased in popular media (GLAAD, 2023[14]), and discussions on non-cisgender issues have become more prevalent in the public debate. Since 2021, the share of US adults who have any friends or relatives or co-workers who have told them, personally, that they are transgender has increased from 31% to 39% in 2023. Results from a 2021 Pew Research Center survey, a nationally representative survey of American adults, found similar increases in the number of American adults who reported personally knowing someone who is transgender or who prefers gender-neutral pronouns – 42% and 26%, respectively, up from 37% and 18% a few years earlier (Pew Research Center, 2021[15]).2 However, the study found virtually no change in the proportion of Americans who believe that gender is defined by sex assigned at birth (56%), or who report discomfort using gender-neutral pronouns to refer to someone (48%, nearly a majority). More recently, during the 2021-23 period, the share of American adults supporting transgender individuals has decreased (Figure 3.2).

Note: The data stem from the “Values and Beliefs” poll conducted annually in May, as part of the Gallup Poll Social Series. They rely on the following question: “Do you think marriages between same-sex couples should or should not be recognised by the law as valid, with the same rights as traditional marriages?”, with answer options: “Should be valid”, “Should not be recognised as valid”, “Don’t Know”, and refused to answer.
Source: Gallup Poll Social Series (2004-23). Person-level weights used.

Note: The data stem from the “Values and Beliefs” poll conducted annually in May, as part of the Gallup Poll Social Series. In 2021 and 2023, this poll included the following three questions: 1) “Next, we have a question about policies for competitive sports that have separate teams for male and female athletes. Do you think transgender athletes – [rotated: should be able to play on sports teams that match their current gender identity (or) should only be allowed to play on sports teams that match their birth gender]?”, with answer options: ”Transgender athletes should be able to play on sports teams that match their current gender identity”, “Transgender athletes should only be allowed to play on sports teams that match their birth gender” “Don’t Know”, and refused to answer. 2) “Next, I’m going to read you a list of issues. Regardless of whether or not you think it should be legal, for each one, please tell me whether you personally believe that in general it is morally acceptable or morally wrong. How about – Changing one’s gender”, with answer options: ”Morally acceptable”, “Morally wrong”, “Depends on the situation”, “Not a moral issue”, “Don’t Know”, and refused to answer. 3) “Do you favor or oppose allowing openly transgender men and women to serve in the military?”, with answer options: “Favor”, “Oppose”, “Don’t Know”, and refused to answer. The averages for 2021 and 2023 are computed using information from 1) and 2), which were available in both years. It is worth noting that 2021 was not the first year when attitudes towards transgender individuals were assessed. This occurred first in 2016, when respondents were queried about their support for allowing transgender individuals to use restrooms corresponding to their gender identity. Although this question differs from those asked in 2021 and 2023, the results suggest that attitudes towards transgender individuals have deteriorated over time: in 2016, 43% of respondents supported policies allowing transgender individuals to use public restrooms that align with their gender identity, a higher figure than 34.5% of respondents who expressed support for transgender individuals in 2023.
Source: Gallup Poll Social Series (2021 and 2023). Person-level weights used.
3.2.2. Perception of discrimination among LGBTI+ Americans
While there have been strides in the social acceptance of LGBTI+ individuals, particularly cisgender lesbians and gay men, the perception of discrimination continues to be widespread among Americans who identify as non-heterosexual and/or non-cisgender. A US survey conducted in 2022 by the Center for American Progress revealed significant disparities in experiences of discrimination between LGBTI+ and non-LGBTI+ Americans (Medina and Mahowald, 2023[16]). For this survey, approximately 1 500 non-LGBTI+ adults were recruited based on probability sampling, and 1 800 LGBTI+ adults using a mix of probability sampling and opt-in panels. The findings indicate that LGBTI+ Americans encounter discrimination at much higher rates than their non-LGBTI+ counterparts. Specifically, LGBTI+ respondents reported nearly double the rate of discrimination in the year preceding the survey, at 36% compared to 19% for non-LGBTI+ respondents. This ratio increases to 3 and 3.5 for non-cisgender and intersex respondents, respectively. These disparities were consistent across various settings, including employment, healthcare, housing, and interactions with law enforcement. For example, although the survey was conducted after the 2020 U.S. Supreme Court’s decision to extend non-discrimination protections to LGBT people, 23% of LGBTI+ respondents reported discrimination in the labour market, compared to 17% of non-LGBTI+ respondents. On average, 1 in 5 LGBTI+ respondents reported they had been fired or not hired (22%), denied equal pay or promotion (21%), or subjected to reduced work hours or detrimental changes in work conditions (17%) due to their sexual orientation, gender identity, or intersex status. In addition, (Coffman, Coffman and Marzilli, 2024[12]) found that non-binary individuals report experiencing more discrimination based on their gender than do men or women across a variety of situations.
Concealment of one’s LGBTI+ identity is a widespread phenomenon, often adopted to avoid discrimination. A substantial 78% of LGBTI+ respondents, including 90% of non-cisgender individuals, have reported taking at least one concealment action to avoid experiencing discrimination (Medina and Mahowald, 2023[16]). These actions include hiding a personal relationship or altering one’s dress style, strategies employed by 55% and 39% of LGBTI+ individuals, respectively. High-skilled individuals, such as college graduates, are no exception to this trend. An analysis, grounded in a representative sample of young individuals in the United States who have received a bachelor’s degree, revealed that a mere 32% of those identifying as LGBTI+ were open about their identity in family, social, and work environments, with the workplace emerging as the predominant setting for concealment (Folch, 2022[17]). This pattern is especially prevalent among bisexuals, presumably due to experiencing lower levels of social acceptance (Folch, 2022[17]; Brown, 2019[18]; Herek et al., 2010[9]).
Concealment aimed at avoiding discrimination based on sexual orientation, gender identity, or intersex status is unlikely to significantly improve the lived experiences of LGBTI+ individuals. For example, even if these individuals choose not to disclose their personal lives in professional settings, their labour market outcomes may still be adversely affected. First, people might infer their sexual orientation or gender identity, even inaccurately, based on their gender atypicality – a departure, both in terms of appearance and behaviour, from the social expectations associated with one’s assigned sex at birth, such as a boy who enjoys playing with dolls or a girl who is interested in mechanical work. There is evidence suggesting that gender atypical gay men, for example, are more likely to be identified as such by external observers, even those unfamiliar with them (Miller, 2018[19]; O. Rule and Ambady, 2008[20]). Similarly, when not outwardly apparent, a transgender identity might still be revealed, such as during employers’ review of identity documents or diplomas for transgender individuals who have not undertaken the legal process of changing their gender marker. Additionally, concealing one’s identity can obstruct the formation of authentic relationships with colleagues and managers, affecting workplace collaboration, mentorship and support. Specifically, closeted LGBTI+ individuals might avoid networking or professional development opportunities to mitigate the risk of disclosure of their identity (Human Rights Campaign Foundation, 2018[21]). Furthermore, the constant management of information about their identities and fear of unintended disclosure can result in significant stress and anxiety, impacting job performance, focus, and productivity. The mental and emotional strain of maintaining separate public and private personalities can even contribute to severe mental health disorders (Folch, 2022[17]; Pachankis et al., 2020[22]).
The Census Bureau’s Household Pulse Survey, along with the surveys that Gallup has conducted since 2012, include questions on annual household income (Box 3.1). This section first examines household income by sexual orientation and gender identity, including through a dynamic perspective to explore the impact of the COVID-19 pandemic. It then further disaggregates the data by sex assigned at birth and age, before discussing the reasons behind the observed gaps.
This Box presents the questions related to household income that are asked in the HPS and in the Gallup surveys and explains how we turn these categorical variables into continuous variables, through the use of interval regression.
1) Household income categorical survey questions:
Household Pulse Survey (2021-23) question: “In [previous year] what was your total household income before taxes? Select only one answer.”, with answer categories: 1) Less than $25,000, 2) $25,000 – $34,999, 3) $35,000 – $49,999, 4) $50,000 – $74,999, 5) $75,000 – $99,999, 6) $100,000 – $149,999, 7) $150,000 – $199,999, 8) $200,000 and more.
Gallup US Daily Survey (2012-17) question: “What is your total ANNUAL household income, before taxes? Please include income from wages and salaries, remittances from family members living elsewhere, farming, and all other sources”, with answer categories: 1) Under $720, 2) $720 to $5 999, 3) $6,000 to $11,999, 4) $12,000 to $23,999, 5) $24,000 to $35,999, 6) $36,000 to $47,999, 7) $48,000 to $59,999, 8) $60,000 to $89,999, 9) $90,000 to $119,999, 10) $120,000 and over.
Gallup Panel – COVID-19 Survey (2020) “What is your total annual household income before taxes?”, with answer categories: 1) Less than $12,000, 2) $12,000 to $23,999, 3) $24,000 to $35,999, 4) $36,000 to $47,999, 5) $48,000 to $59,999, 6) $60,000 to $89,999, 7) $90,000 to $119,999, 8) $120,000 to $179,999, 9) $180 000 to $239,999, 10) $240,000 and over.
2) Interval regression:
We then use an interval regression to turn these categorical variables into continuous variables, by making use of the “intreg” command in Stata.
An interval regression fits a linear model to an outcome that is unobserved but known to fall within some interval. Such censored data arise naturally in many contexts, such as income data. In this case, the exact values of household income are unobserved but known to fall within an interval with fixed endpoints (interval-censored data), unobserved but known to fall within an interval that has a fixed upper endpoint (left-censored data), and unobserved but known to fall within an interval that has a fixed lower endpoint (right-censored data).
The “intreg” command requires the outcome to be stored in the dataset as interval data. That is, two variables, “income1” and “income2”, are used to hold the endpoints of the interval. For the left-censored data, the lower endpoint is assumed to be minus infinity and is represented by a missing value in “income1”. For the right-censored data, the upper endpoint is assumed to be infinity and is represented by a missing value in “income2”. The other interval-censored data are represented by the two endpoints being equal.
Finally, we turn the resulting two variables (“income1” and “income2”) in logarithms. The interval regression model assumes normality, but the distribution of income is skewed and definitely non-normal. Thus, normality is more closely approximated if we model the logarithm of income.
Source: Household Pulse Survey, Gallup, and Stata documentation (www.stata.com/manuals/rintreg.pdf)
3.3.1. Comparing household income by sexual orientation and gender identity
In 2023, LGBTI+ adults had an average annual household income that was 17% lower than that of cisgender straight adults, as shown in Panel A of Figure 3.3. Breaking it down further, cisgender LGB+ adults faced a 13% penalty. Notably, the subgroup of gay men and lesbians faced no penalty (indeed, they face a small premium), while penalties were 18% for bisexuals and 31% for other non-heterosexuals. Non-cisgender individuals experienced a more severe penalty at 34%, prevailing both for transgender and other non-cisgender individuals. Correspondingly, as depicted in Panel B of Figure 3.3, LGBTI+ Americans were disproportionately represented in lower income brackets and under-represented in higher ones compared to cisgender straight peers. Specifically, 17% of LGBTI+ adults lived in households earning less than USD 25 000 annually, in contrast to 12% of cisgender straight adults. On the higher end, 28% of LGBTI+ adults resided in households with incomes of USD 100 000 or above, compared to 35.5% of cisgender straight adults. The disparity was especially pronounced among non-cisgender adults. Almost one in four (24.5%) non-cisgender individuals lived in households earning less than USD 25 000 annually, while this was the case for only 15% of cisgender LGB+ adults.


Note: Average annual household income is estimated from an Interval regression of the logarithm of household income. Person-level weights used. See Box 3.1 for more details on Interval regression methodology. In Panel A, the percentages represent the percentage difference in the estimated average annual household income between LGBTI+ (or LGBTI+ subgroups) and cisgender straight adults. In Panel B, the percentages represent the two population groups with the lowest (in white) and with the highest (in black) percentage within each income bracket. For instance, 12% of cisgender straight adults and 24.5% of non-cisgender adults have an annual household income below USD 25 000, while 8% of non-cisgender adults and 10% of cisgender straight adults have an annual household income above USD 200 000.
Source: Household Pulse Survey (4 January 2023 – 10 July 2023).
An analysis of combined 2021 and 2023 HPS data underscores that these income differences, although substantially reduced, remain significant after accounting for the demographic differences illustrated in Chapter 2 (Figure 3.4). On average, LGBTI+ adults experience an 8% lower annual household income than cisgender straight adults. The income penalty is more pronounced for non-cisgender individuals (11%) than for cisgender LGB+ adults (7%). Among LGBTI+ subgroups, only cisgender homosexuals do not face a significant income penalty. Cisgender bisexual adults have an 8.5% lower household income compared to cisgender straight adults. In contrast, cisgender adults with other non-heterosexual orientations experience an income penalty that is roughly twice as large (16.5%). For non-cisgender adults, there is no significant difference in the household income penalties between transgender individuals (10%) and those of other non-cisgender orientations (12%).
An analysis that considers how different forms of disadvantages combine shows that the household income disparities experienced by LGBTI+ individuals are more severe for those who also belong to other marginalised groups, specifically individuals assigned female at birth (see Box 3.2). This increased disadvantage, however, does not apply to LGBTI+ individuals who are non-White or Hispanic or disabled, highlighting the complex interplay of various identities.
An intersectional analysis recognises that individuals hold multiple identities and examines how different facets of their identity interact and shape individuals’ experiences. The scarcity of research that combines an intersectional analysis of LGBTI+ identities with other marginalised statuses flows from the small sample size of the LGBTI+ population in representative datasets. The Household Pulse Survey, with its extensive data on LGBTI+ adults, provides a unique opportunity for such analysis. Relying on this dataset, (Carpenter, Lee and Nettuno, 2022[23]) identified disparities in employment rates among non-cisgender Black individuals compared to their non-cisgender White counterparts, regardless of their sex assigned at birth. In a similar vein, (Martell and Roncolato, 2023[24]) found that racial and ethnic minorities faced heightened disadvantages in some employment outcomes and some measures of economic vulnerability when also identifying as gay/lesbian or bisexual. However, for many of these outcomes, the intersectional impact of being LGBTI+ didn’t exacerbate the racial/ethnic disadvantage.
Building on this method, we expand the regression used to estimate the unexplained LGBTI+ household income gap shown in Figure 3.4 and run three distinct regressions by adding: 1) an interaction term for LGBTI+ identity with sex assigned at birth, 2) an interaction term for LGBTI+ identity with race/ethnicity (defined using a binary variable that is zero for White non-Hispanic respondents and one for respondents who are non-White or Hispanic), and 3) a variable indicating whether the respondent has a disability, along with its interaction with LGBTI+ identity. Moreover, we run the regression for each intersection – race/ethnicity and disability with LGBTI+ identity – separately among AFAB and AMAB individuals.
The regression results indicate a 27% income penalty for LGBTI+ adults assigned female at birth compared to cisgender straight adults assigned male at birth. Additionally, LGBTI+ adults who are non-White or Hispanic encounter a 26% income disadvantage compared to their White non-Hispanic cisgender straight counterparts, while LGBTI+ adults with disability face a similar income reduction when compared to cisgender straight adults without disability. These penalties are consistent across individuals assigned male or female at birth. However, our analysis does not reveal a cumulative effect of race/ethnicity and disability on the LGBTI+ income gap for either AFAB or AMAB individuals. Specifically, while AFAB LGBTI+ individuals endure an income penalty relative to AFAB cisgender straight individuals, non-White or Hispanic LGBTI+ individuals do not suffer an additional income penalty relative to their non-White or Hispanic cisgender straight peers, nor do LGBTI+ individuals with disability compared to cisgender straight individuals with disability. These findings emphasise the need for further research to thoroughly comprehend the layered effects of possessing multiple marginalised identities.
Note: The Household Pulse Survey (HPS) includes six disability-related questions: 1) “Do you have difficulty seeing, even when wearing glasses?”, 2) “Do you have difficulty hearing, even when using a hearing aid?”, 3) “Do you have difficulty walking or climbing stairs?”, 4) “Do you have difficulty remembering or concentrating?”, 5) “Do you have difficulty with self-care, such as washing all over or dressing?”, 6) “Using your usual language, do you have difficulty communicating, for example understanding or being understood?”. In line with the Centers for Disease Control and Prevention (CDC) guidelines, adults who report “a lot of difficulty” or an inability to perform any of these six functions (seeing, hearing, cognition, mobility, self-care, and communication) are classified as having a disability. Conversely, those who indicate “no difficulty” or “some difficulty” across all six areas are not classified as having a disability. According to this metric, it is estimated that 12% of the US adult population has a disability, with 2% identified as both LGBTI+ and disabled.
Several scholars analysing the Household Pulse Survey data from July 2021 to May 2022 have found results consistent with those reported in Figure 3.4 (Martell and Roncolato, 2023[24]; Carpenter, Lee and Nettuno, 2022[23]). Research from alternative datasets confirms these findings. For example, homosexual adults were found to have a similar poverty rate as straight adults. However, bisexuals and other sexual minorities were more likely to be impoverished than their straight counterparts with the same demographic characteristics. These results are consistent across different datasets, including the National Health Interview Survey (Badgett, Carpenter and Sansone, 2021[25]; Badgett, 2018[26]), the General Social Survey (Chai and Maroto, 2019[27]) and the Behavioural Risk Factor Surveillance System (Badgett, Choi and Wilson, 2019[28]). The larger income penalty for non-cisgender individuals was also confirmed based on the latter survey: transgender adults fare worse economically, with higher poverty rates compared to both cisgender LGB and straight adults (Carpenter, Eppink and Gonzalez, 2020[29]; Badgett, Choi and Wilson, 2019[28]). The 2022 survey by the Center for American Progress further sheds light on this disparity. It revealed that 34% of intersex LGBTI+ respondents had a household income of less than USD 25 000 annually, compared to 27% of non-intersex LGBTI+ respondents (Medina and Mahowald, 2021[30]).

Note: The percentage differences are estimated from an Interval regression of the logarithm of household income, controlling for sex assigned at birth, age groups (18-24, 25-29, 30-34, …, 80-84, 85-88), race and ethnicity, marital and parental status, number of adults in the household, educational attainment, living in one of the 15 largest metropolitan statistical areas (metro areas), as well as state and survey wave fixed effects. The error bars depict 95% confidence intervals. This means that we can be 95% confident that the true value lies within the range of the error bar. In other words, if the error bar crosses the x-axis, then the percentage point difference cannot be deemed as statistically different from 0 (at least not at this 95% confidence level). Standard errors robust to heteroscedasticity. Person-level weights used. See Box 3.1 for more details on Interval regression methodology.
Source: Household Pulse Survey (21 July 2021 – 10 July 2023).
An analysis of income disparities for LGBT people over time indicates that the COVID-19 pandemic exacerbated their economic challenges (Figure 3.5). Between 2012 and 2017, the LGBT income penalty estimated from the Gallup US Daily was 7%, which aligns with the 6% LGBT income penalty observed in the HPS data from 2021 to 2023. However, from April to December 2020, the Gallup COVID-19 survey recorded a significantly higher LGBT income penalty of 12.5%. These results are consistent with previous findings suggesting that, notably due to their lower incomes, LGBTI+ adults are especially vulnerable during crises (OECD, 2021[31]; Wenham, 2020[32]; Movement Advancement Project, 2020[33]). It is worth noting that the 6% income penalty observed when pooling data from 2021 to 2023 remains virtually unchanged when focusing solely on 2023 (Figure 3.5). This consistency suggests that the penalty shown in Figure 3.4 does not merely reflect the impact of the COVID-19 pandemic, but a structural disadvantage for LGBTI+ individuals.

Note: The percentage differences are estimated from an Interval regression of the logarithm of household income, controlling for sex assigned at birth, age groups (18-24, 25-29, 30-34, …, 80-84, 85-88), race and ethnicity, marital and parental status, number of adults in the household, educational attainment, living in one of the 15 largest metropolitan statistical areas (metro areas) – only in the HPS data -, as well as state and survey wave fixed effects. The error bars depict 95% confidence intervals. This means that we can be 95% confident that the true value lies within the range of the error bar. In other words, if the error bar crosses the x-axis, then the percentage point difference cannot be deemed as statistically different from 0 (at least not at this 95% confidence level). Standard errors robust to heteroscedasticity. Person-level weights used. See Box 3.1 for more details on Interval regression methodology.
Source: Gallup US Daily Survey (2012-17), Gallup Panel – COVID-19 Survey (March – December 2020), Household Pulse Survey (21 July 2021 – 10 July 2023).
3.3.2. Disaggregating household income gaps by sex assigned at birth and age
When examining household income disparities by sex assigned at birth (Figure 3.6), the patterns observed in Figure 3.4 for cisgender LGB+ adults are consistent for both those assigned males at birth (AMAB) and those assigned females at birth (AFAB). Specifically, regardless of sex assigned at birth, the income penalty is smallest for gay men and women, larger for bisexual men and women, and largest for cisgender men and women with other non-heterosexual orientations. Nevertheless, within these subgroups, the magnitude of the penalty does vary by sex assigned at birth. For example, while the penalty for cisgender gay men isn’t statistically significant, cisgender lesbians face a discernible, albeit modest, significant penalty (2%). In comparison, cisgender bisexual and other non-heterosexual individuals have a more pronounced penalty if they are AMAB than if they are AFAB. It should be emphasised that the absence of a significant unexplained household income gap for cisgender gay men does not indicate they are unaffected by discrimination. In fact, in line with their educational premium highlighted in Chapter 2, this absence could mirror their effort to bolster a broad spectrum of cognitive and socioemotional skills as a compensatory strategy against discrimination. Given this extensive personal investment, the lack of an observable income advantage for them hints at opposing forces at play, such as exclusionary attitudes and behaviours.
Unlike the patterns observed for cisgender LGB+ adults, the penalty that prevails among non-cisgender adults – suggesting a similar household income gap for transgender and other non-cisgender individuals – masks differences by sex assigned at birth. Among AMAB individuals, the gap with cisgender straight peers is most pronounced for transgender individuals. In contrast, among AFAB individuals, other non-cisgender individuals experience the strongest disadvantage. Notably, the household income difference for transgender individuals assigned female at birth is not statistically significant when compared to cisgender straight females. This finding aligns with prior research. In particular, studies have indicated that transgender men in the United States may experience a slight increase in labour earnings after transitioning, suggesting that the societal advantages associated with being recognised as a man may compensate the stigma associated with transitioning (Schilt and Wiswall, 2008[34]). According to Figure 3.6, this increase in earnings is indeed not sufficient to translate into an improved economic situation for transgender individuals assigned female at birth in comparison to cisgender straight women. One explanation could be that only a minority of these transgender individuals are trans men who have completed their gender transition. Conversely, transitioning has been found to reduce wages for transgender women in the United States, a trend that aligns with the stigma of transitioning combining with the societal disadvantages of being recognised as a woman (Schilt and Wiswall, 2008[34]). Consistent with this surmise, Figure 3.6 shows a 18% income penalty for transgender individuals assigned male at birth when compared to cisgender straight men.

Note: The percentage differences are estimated from an Interval regression of the logarithm of household income, controlling for age groups (18-24, 25-29, 30-34, …, 80-84, 85-88), race and ethnicity, marital and parental status, number of adults in the household, educational attainment, living in one of the 15 largest metropolitan statistical areas (metro areas), as well as state and survey wave fixed effects. The error bars depict 95% confidence intervals. This means that we can be 95% confident that the true value lies within the range of the error bar. In other words, if the error bar crosses the x-axis, then the percentage point difference cannot be deemed as statistically different from 0 (at least not at this 95% confidence level). Standard errors robust to heteroscedasticity. Person-level weights used. See Box 3.1 for more details on Interval regression methodology.
Source: Household Pulse Survey (21 July 2021 – 10 July 2023).
The income penalty for LGBTI+ individuals decreases with age. Among young people aged 18-34, the disparity is 9%, which changes to 8% for those in their prime age (35-54), and 3% for mature people (55+), as shown in Figure 3.7. When focusing on cisgender LGB+ adults, cisgender bisexuals and other non-heterosexual individuals face income disparities across all age groups. This pattern holds true for both AMABs and AFABs. As for cisgender homosexuals, they exhibit a different trend: while mature gay men and lesbians have a slight statistically significant income premium, this advantage disappears for younger generations, becoming a significant penalty (7%) for young cisgender lesbians. Regarding non-cisgender adults, both young people and those in their prime age experience a significant income penalty (a trend that is consistent for both AMABs and AFABs), while no disadvantage is observed among mature non-cisgender adults. Chapter 2 delved into one potential explanation behind the modest income premium for mature cisgender homosexuals and the non-significant income penalty for mature non-cisgender adults, suggesting the influence of a “non-disclosure bias” (Valfort, 2017[3]): mature LGBTI+ adults from privileged background might be more willing to identify openly as LGBTI+ than those from less privileged backgrounds. Another perspective, developed in Section 3.5, touches upon health disparities. In a context where LGBTI+ individuals show poorer health outcomes, it is possible that self-identified LGBTI+ adults who lived up to a mature age are more likely to come from advantaged backgrounds that equipped them to more easily navigate health challenges.


Note: The percentage differences are estimated from an Interval regression of the logarithm of household income, controlling for age groups, sex assigned at birth (only when the analysis is performed over all respondents), race and ethnicity, marital and parental status, number of adults in the household, educational attainment, living in one of the 15 largest metropolitan statistical areas (metro areas), as well as state and survey wave fixed effects. The error bars depict 95% confidence intervals. This means that we can be 95% confident that the true value lies within the range of the error bar. In other words, if the error bar crosses the x-axis, then the percentage point difference cannot be deemed as statistically different from 0 (at least not at this 95% confidence level). Standard errors robust to heteroscedasticity. Transgender and other non-cisgender were not separately analysed for prime age and mature adults due to low sample size of transgender individuals. Person-level weights used. See Box 3.1 for more details on Interval regression methodology.
Source: Household Pulse Survey (21 July 2021 – 10 July 2023).
3.3.3. Accounting for the unexplained household income penalty for LGBTI+ adults
Several factors, all arising from the discriminatory contexts that LGBTI+ individuals encounter, have been identified as key drivers to the unexplained household income penalty they face. Sections 0 and 3.5 delve into the most significant of these factors. They shed light on the disparities LGBTI+ individuals experience with respect to labour market and health outcomes, bearing in mind that these disparities are not independent of each other but mutually reinforcing. On the one hand, discrimination in the labour market can adversely impact health, through different channels. For instance, a study in Italy indicates that prior experiences of workplace discrimination are closely linked to the decision of transgender individuals, who are notably overrepresented among prostitutes, to pursue sex work – a profession with a high prevalence of HIV and other sexually transmitted diseases (D’Ippoliti and Botti, 2017[35]). Conversely, health challenges faced by LGBTI+ individuals can decrease their productivity at work, further perpetuating labour market discrimination against them, especially in places like the United States where the stigmatisation of mental health issues remains prevalent (OECD, 2021[36]).
Beyond labour market and health gaps, several other factors impact the economic situations of LGBTI+ adults, of which three stand out. Firstly, LGBTI+ individuals are often less likely to receive family support. Some are expelled from their homes after disclosing their LGBTI+ identity, leading to housing crises for a number of LGBTI+ adolescents (National Academies of Sciences, Engineering, and Medicine, 2020[37]; Dunne, Prendergast and Telford, 2002[38]; Rew, Fouladi and Yockey, 2002[39]). For instance, the 2014 LGBTQ Homeless Youth Provider Survey indicated an overrepresentation of LGBTI+ youth among homeless people (close to 30%). Among the respondents, 55% of LGB individuals and 67% of transgender individuals attributed their homelessness to either being evicted or fleeing their homes due to their sexual orientation and/or gender identity (Choi et al., 2015[40]). In addition, according to a Pew Research Center survey conducted in 2013, about four-in-ten (39%) LGBT adults said that at some point in their lives they were rejected by a family member or close friend because of their sexual orientation or gender identity (Pew Research Center, 2013[41]). Consistently, LGBTI+ individuals are also less likely to receive economic support from their families during challenging times or to finance their education (Badgett, 2014[42]).
Secondly, evidence suggests that LGBTI+ individuals face discrimination when trying to access credit, which hampers their capacity to build wealth. It has been well-established that same-sex couples are less likely to own homes compared to their different-sex peers, and when they do own, they are less likely to have a mortgage (National Academies of Sciences, Engineering, and Medicine, 2020[37]; Jepsen and Jepsen, 2009[43]; Leppel, 2007[44]; Leppel, 2007[45]). After income and demographic adjustments, the Household Pulse Survey confirms these findings: self-identified LGBTI+ adults are 5 percentage points (7%) less likely to be homeowners, compared to cisgender straight adults. This penalty is significant across all LGBTI+ subgroups, with transgender facing the most significant penalty. In addition, all these penalties remain even when restricting the sample to married adults living with only another adult (likely the spouse).3 A recent study uncovers a potential driver by showing that same-sex couples experience discrimination in mortgage lending. This finding is predominantly driven by applications from male same-sex pairs – the treatment of female same-sex co-applicants, in contrast, appears indistinguishable from that of different-sex couples (Dillbary and Griffin, 2019[46]). Specifically, an analysis of over 5 million mortgage applications to the Fair Housing Administration (FHA) reveals that mortgage applications by same-sex male co-applicants are significantly less likely to be approved than those from heterosexual couples, even though FHA-insured mortgage lenders are prohibited from discriminating based on sexual orientation. This result holds true although the same-sex male pairs were identical to their different-sex peers in all reported respects: they filed a mortgage application with the same lender, in the same county, for the same loan amount, for the same purpose, had the same income, and posed the same level of risk to the lender.
Thirdly, different expectations about future family formation may affect not only career choices, but also investment and savings decisions (Coffman, Coffman and Marzilli, 2024[12]; Tate and Patterson, 2019[47]). As recalled in Chapter 2, despite recent increases in partnership and marriage rates among LGBTI+ adults, many still have low expectations about becoming parents. Growing reliance on adoption, assisted reproductive technology, and surrogacy among LGBTI+ individuals is mitigated by difficult access to these methods, due to a combination of legal, financial, and discriminatory barriers.4
This section first provides a brief overview of previous research on anti-LGBTI+ discrimination, relying on both experimental and observational data. It then takes advantage of HPS and Gallup data to compare labour market outcomes by sexual orientation and gender identity, focusing on unexplained gaps in both employment rates and labour earnings.
3.4.1. Anti-LGBTI+ discrimination in the labour market: an overview of previous research
Objective measures of discrimination are consistent with the subjective perceptions of discrimination reported by LGBTI+ individuals. As detailed in Section 3.2, an average of 1 in 5 LGBTI+ respondents report experiences such as being fired, not hired, denied equal pay or promotion, or subjected to reduced work hours or detrimental changes in work conditions due to their sexual orientation, gender identity, or intersex status (Medina and Mahowald, 2023[16]). These perceptions align with employers’ attitudes and behaviours, as observed in laboratory or field experiments conducted in the United States. They are also in line with unexplained labour market gaps between LGBTI+ and non-LGBTI+ individuals, based on representative survey data. Against this backdrop, it is no surprise that thousands of people in the United States filed charges of employment discrimination based on sexual orientation or gender identity between 2013 and 2016 (Baumle, Badgett and Boutcher, 2019[48]).
Objective measures of anti-LGBTI+ discrimination in the labour market stemming from experimental data
In a recent laboratory experiment at a public Midwestern University involving introductory psychology students, participants assuming the role of employers were tasked with evaluating job applications. The results showed that, with the same CV, gay and/or lesbian applicants were rated significantly lower in competence, social skills and employability compared to heterosexual applicants. This gap widened with the degree to which the “employers” endorsed traditional gender norms (Bryant-Lees and Kite, 2021[49]).
In the field, similar results are obtained from correspondence studies. These involve sending out, in response to real job ads, the CVs and letters of application of fictitious candidates who are identical except for their sexual orientation or gender identity. A male candidate indicating he worked as treasurer for the gay and lesbian campus organisation has 60% fewer chances of being invited to a job interview than his straight counterpart with experience as treasurer in another progressive student association (Tilcsik, 2011[50]). Similarly, a female candidate highlighting leadership roles in a lesbian, gay, bisexual, and transgender student organisation to signal queer identity receives 30% fewer callbacks than her cisgender straight peer who, with similar experience in a non-LGBT progressive student organisation, is perceived by default by employers as a cisgender straight woman (Mishel, 2016[51]).
Field experiments focused specifically on transgender individuals have consistently uncovered significant discrimination. In one correspondence study, researchers compared the callback rate for fictitious male-to-female transgender candidates with those of fictitious cisgender female candidates applying for high-skilled jobs in Texas (Bardales, 2013[52]). The gender identity of the fictitious candidates was conveyed using three key pieces of information on the CV: i) the transgender woman listed her preferred name alongside her legal name, e.g. “Anne McCarthy (Legal Name: Greg McCarthy)”, while the cisgender woman only mentioned her legal name; ii) the transgender woman highlighted her membership in the “Transgender Women’s Support Group at UT San Antonio”, whereas the cisgender woman noted her involvement in the “Women’s Health Center at UT San Antonio”; iii) the transgender woman described her role in “Male-to-Female Youth Peer Counseling”, while the cisgender woman highlighted her participation in “Young Girls Peer Counseling and Mentorship”. The study’s findings were stark: the cisgender woman’s callback rate was 50% higher than that of the transgender woman. This outcome aligns with results from a 2008 small-scale experiment in Manhattan’s retail sector. In that study, out of 24 tested employers, male-to-female, female-to-male, and gender-nonconforming transgender applicants were six times less likely to receive a job offer compared to their cisgender peers. Specifically, while 50% of cisgender applicants received job offers, only 8% of transgender applicants did (Make the Road New York, 2010[53]).
Recently, a large-scale correspondence study conducted in the United States from 2019 to 2021 and involving over 100 Fortune 500 companies, offered additional insights (Kline, Rose and Walters, 2022[54]; Kline, Rose and Walters, 2024[55]). While primarily focused on assessing gender- and race-based discrimination, the study also explored other legally protected characteristics, including age and LGBTI+ identity. The findings reveal a penalty for white applicants who indicate LGBTI+ club membership on their resumes. This result emerges despite the study focusing on large firms, which are typically thought to exhibit less discriminatory behaviour due to more standardised hiring procedures. In contrast, indicating LGBTI+ club membership appears to benefit Black applicants, underscoring, following Box 3.2, the intricate interplay of different identities.
It is important to emphasise that correspondence studies likely understate the extent of hiring discrimination against LGBTI+ job candidates since they do not analyse subsequent job interview outcomes. For instance, several field experiments addressing racial and ethnic discrimination in hiring combine correspondence studies with audit studies. In these audit studies, actors represent the fictitious applicants during actual job interviews. Evidence from such combined studies reveals significant second-stage discrimination: candidates representing the racial or ethnic majority not only receive 53% more callbacks but also continue to receive 145% more job offers compared to their minority counterparts (Quillian, Lee and Oliver, 2020[56]). This trend is likely to gain importance given the growing reliance of employers on automated CV screening tools. Such tools might push discriminatory practices further down the hiring process, making face-to-face interviews the stage where biases are most likely to emerge.
Unexplained labour market gaps between LGBTI+ and non-LGBTI+ individuals, based on representative survey data
Evidence from representative survey data indicates that discrimination – or the fear of discrimination leading to the development of detrimental coping strategies such as concealment or covering behaviours (Section 3.2.2) – adversely affects the labour market trajectories of LGBTI+ individuals. Since Badgett’s seminal 1995 article, which showed a significant individual labour earnings penalty for gay and bisexual men (Badgett, 1995[57]), a large body of research has explored labour market disparities based on sexual orientation and gender identity. A review of these studies reveals significant penalties for LGBTI+ individuals in terms of employment rates, hours worked and hourly labour earnings, even when accounting for essential demographics – as well as, for those employed, accounting for economic sectors and occupations (Drydakis, 2022[58]; OECD, 2019[1]; Valfort, 2017[3]; Klawitter, 2015[59]; Carpenter, Lee and Nettuno, 2022[23]).
The labour market penalty found by these studies is consistent across all LGBT subgroups, with the notable exception of lesbians. This leads to contrasting results within the homosexual population: lesbians experience a labour market premium compared to heterosexual women, while gay men face a labour market penalty in comparison to heterosexual men. One likely explanation for these differences is the varying ways partners within same-sex and opposite-sex couples specialise in paid versus unpaid work, with significantly less household specialisation in same-sex partnerships (Hofmarcher and Plug, 2022[60]; Jepsen and Jepsen, 2015[61]; Jepsen and Jepsen, 2002[62]). Consequently, a partnered homosexual man, on average, engages less in the labour market than a partnered heterosexual man, while a partnered homosexual woman tends to be more involved than her heterosexual counterpart. However, it is worth noting that recent studies focusing on younger cohorts in the United States have documented a significant labour market penalty for lesbians (National Academies of Sciences, Engineering, and Medicine, 2020[37]). This observation aligns with the trend of increasing equality in the sharing of both paid and unpaid work between men and women in heterosexual partnerships, which results in a diminishing “specialisation gap” between same-sex and different-sex couples (Giddings et al., 2014[63]). Consequently, the effects of the household specialisation bias in latest survey data should be attenuated, unveiling the penalty also experienced by lesbians.
Lower labour earnings for LGBTI+ individuals appear to be partly driven by talent misallocation, specifically a glass ceiling effect that hinders LGBTI+ individuals from advancing beyond a certain level in organisational hierarchies (McCay, 2024[64]). Representative data from the United Kingdom shows that LGB employees are, on average, 11% less likely to hold high managerial positions than their heterosexual peers, a trend that affects all subgroups within the LGB population, including lesbians (Aksoy et al., 2019[65]; OECD, 2019[1]).
The unexplained disparities for LGBTI+ individuals are associated with high levels of perceived discrimination. Data from a representative sample of US bachelor’s degree recipients interviewed in 2018 indicate that, ten years after graduation, LGBTI+ individuals earn 10% less than their non-LGBTI+ counterparts, after considering that LGBTI+ individuals choose different occupations compared to their non-LGBTI+ peers, to avoid discrimination. Meanwhile, the study reveals that almost half (48%) of LGBTI+ graduates reported experiencing workplace discrimination due to sexual orientation, gender identity or sex characteristics during the first ten years after graduation. Additionally, one-third of respondents did not find their current employer very accepting of LGBTI+ employees. In line with concealment strategies being detrimental to LGBTI+ individuals’ labour market trajectories, the study also found a more pronounced labour earnings gap for those who remain closeted in the workplace, compared to those who are open about their identities (Folch, 2022[17]).
3.4.2. Comparing labour market outcomes by sexual orientation and gender identity
This section explores labour market gaps between LGBTI+ and non-LGBTI+ individuals. Two outcomes are analysed: employment rate and, for those employed, productivity per worker, as measured by labour earnings, obtained by multiplying hours worked by hourly wage.
The analysis introduces two restrictions to the original sample of LGBTI+ and non-LGBTI+ respondents this report has been exploring thus far. First, we focus on working-age adults, meaning that those above 74 are excluded from the analysis. Second, we restrict our attention to individuals living alone (with no other adult or children in the household) to eliminate the potential bias from different household specialisation across same-sex and different-sex couples. This approach to obtaining more accurate estimates of labour market disparities for LGBTI+ individuals has been implemented by several researchers before us – see the pioneering work of (Aksoy, Carpenter and Frank, 2018[66]) based on UK data – but with limited success. Indeed, focusing on singles reduced the sample size to such an extent that many of the penalties found could not be regarded as statistically different from zero. By contrast, the large number of observations contained in the HPS dataset offers a unique opportunity to run this strategy, with a lower likelihood of encountering false negatives. The number of working age adults living alone in the HPS dataset for the period between 2021 and 2023 is equal to 263 499, of which 35 174 report being LGBTI+. As expected, compared to focusing on the whole set of working-age adults, focusing on those living alone results in a lower labour market penalty for LGBTI+ individuals assigned male at birth, but a greater labour market penalty for their peers assigned female at birth. Overall, the penalty is slightly higher when computed on adults living alone.5
Unexplained gaps in employment rate between LGBTI+ and non-LGBTI+ individuals
LGBTI+ US adults living alone are 4 percentage points (or 7%) less likely to be employed, compared to their cisgender straight peers, as shown in Panel A of Figure 3.8. Additionally, they are 2 percentage points (or 24%) more likely to experience job loss (Panel B of Figure 3.8). These disparities prevail among all LGBTI+ subgroups, although the gaps are more pronounced for non-cisgender individuals than for cisgender LGB+ individuals. Notably, even cisgender LGBs, who experience a non-statistically significant penalty in terms of employment, face a higher likelihood of losing employment income in the month preceding their interview.

Note: The percentage point differences are estimated from a Logistic regression, controlling for sex assigned at birth, age groups (18-24, 25-29, 30-34, …, 70-74), race and ethnicity, marital status, educational attainment, living in one of the 15 largest metropolitan statistical areas (metro areas), as well as state and survey wave fixed effects. The percentage point differences are estimated at the average of the covariates. The error bars depict 95% confidence intervals. This means that we can be 95% confident that the true value lies within the range of the error bar. In other words, if the error bar crosses the x-axis, then the percentage point difference cannot be deemed as statistically different from 0 (at least not at this 95% confidence level). Standard errors robust to heteroscedasticity. Person-level weights used.
Source: Household Pulse Survey (21 July 2021 – 10 July 2023).
While the employment penalties for LGBTI+ individuals are similar for AMAB and AFAB persons (Figure 3.9), the way this penalty evolves with age differs based on sex assigned at birth. Specifically, the employment penalty for LGBTI+ individuals assigned male a birth decreases with age (Panel A of Figure 3.10), while it increases with age for LGBTI+ individuals assigned female at birth (Panel B of Figure 3.10). This finding suggests that among AFAB individuals, other forces counteract the factors, including the non-disclosure bias, that contribute to reduce the penalty among older LGBTI+ adults. Such could be a combination of sexism, ageism and homophobia, especially given evidence of strong age discrimination against female job candidates in the United States. A large-scale correspondence study, for instance, revealed that hiring discrimination against older applicants is nearly twice as high for women compared to men, with this heightened discrimination against women occurring from the age of 50 upwards (Neumark, Burn and Button, 2019[67]).

Note: The percentage point differences are estimated from a Logistic regression, controlling for age groups (18-24, 25-29, 30-34, …, 70-74), race and ethnicity, marital status, educational attainment, living in one of the 15 largest metropolitan statistical areas (metro areas), as well as state and survey wave fixed effects. The percentage point differences are estimated at the average of the covariates. The error bars depict 95% confidence intervals. This means that we can be 95% confident that the true value lies within the range of the error bar. In other words, if the error bar crosses the x-axis, then the percentage point difference cannot be deemed as statistically different from 0 (at least not at this 95% confidence level). Standard errors robust to heteroscedasticity. Person-level weights used.
Source: Household Pulse Survey (21 July 2021 – 10 July 2023).

Note: The percentage point differences are estimated from a Logistic regression, controlling for age groups, race and ethnicity, marital status, educational attainment, living in one of the 15 largest metropolitan statistical areas (metro areas), as well as state and survey wave fixed effects. The percentage point differences are estimated at the average of the covariates. The error bars depict 95% confidence intervals. This means that we can be 95% confident that the true value lies within the range of the error bar. In other words, if the error bar crosses the x-axis, then the percentage point difference cannot be deemed as statistically different from 0 (at least not at this 95% confidence level). Standard errors robust to heteroscedasticity. Person-level weights used.
Source: Household Pulse Survey (21 July 2021 – 10 July 2023).
The COVID-19 pandemic disproportionately affected the employment of the LGBT(I+) population. Panel A of Figure 3.11 illustrates the evolution over time of the difference in employment rate between LGBT and cisgender straight working-age adults living alone. Over the period 2012-17, the employment penalty estimated from the Gallup US Daily Survey (1.5 percentage points or 2%) was lower than the 2021-23 penalty estimated from HPS (3 percentage points or 5%). However, a much more pronounced LGBT employment penalty was observed in the Gallup Panel – COVID-19 Survey from March to December 2020 (14 percentage points or 21%). Moreover, Panel B of Figure 3.11 displays responses to the survey question “Have you experienced any of the following changes to your employment as the result of the coronavirus?” from the Gallup Panel – COVID-19 Survey. On average, compared to non-LGBT adults, LGBT adults were 4 percentage points (45%) more likely to have been temporarily laid off, 2 percentage points (123%) more likely to have been permanently let go, 7 percentage points (46%) more likely to have had their hours reduced, and 15 percentage points (59%) more likely to have experienced a loss of income. These findings align with results from the KFF COVID-19 Vaccine Monitor, a US-based, nationally representative that surveyed LGBT people between December 2020 and January 2021. This investigation revealed that LGBT adults and their household members experienced COVID-era job losses at higher rates than non-LGBT adults, partly because they were more likely to work in industries hard hit by the pandemic, such as restaurants, food services or art and entertainment. Specifically, 56% of LGBT people reported that they or another adult in their household have lost a job, been placed on furlough, or had their income or hours reduced due to the coronavirus outbreak, in contrast to 44% of non-LGBT individuals (Dawson, Kirzinger and Kates, 2021[68]).


Note: The percentage point differences are estimated from a Logistic regression, controlling for sex assigned at birth, age groups (18-24, 25-29, 30-34, …, 70-74), race and ethnicity, marital status, educational attainment, living in one of the 15 largest metropolitan statistical areas (metro areas) – only in the HPS data -, as well as state and survey wave fixed effects. The percentage point differences are estimated at the average of the covariates. The error bars depict 95% confidence intervals. This means that we can be 95% confident that the true value lies within the range of the error bar. In other words, if the error bar crosses the x-axis, then the percentage point difference cannot be deemed as statistically different from 0 (at least not at this 95% confidence level). Standard errors robust to heteroscedasticity. Person-level weights used.
Source: Gallup US Daily Survey (2012-17), Gallup Panel – COVID-19 Survey (March – December 2020), Household Pulse Survey (21 July 2021 – 10 July 2023) for Panel A. Gallup Panel – COVID-19 Survey (March – December 2020) for Panel B.
Unexplained gaps in labour productivity (hours worked and hourly wage) between LGBTI+ and non-LGBTI+ individuals
In the absence of specific data on individual labour earnings from sources such as the HPS or Gallup surveys, we use household income of employed individuals living alone as a proxy for productivity per worker. On average, accounting for differences in demographics, sectors, and occupations, LGBTI+ workers have labour earnings that are 7% lower than those of their cisgender straight peers (Figure 3.12). The distribution of these labour earnings gaps varies among LGBTI+ subgroups, but the pattern is similar to that observed in Figure 3.4, which analyses household income across the entire adult population. The income penalty is more pronounced for non-cisgender workers (21%) than for their cisgender non-heterosexual counterparts (5%). Within the latter group, cisgender gay/lesbian adults experience the smallest penalty (1%, not significant at the 90% confidence level), followed by cisgender bisexual adults (9%), and finally, by cisgender other non-heterosexual adults (9%).

Note: The percentage differences are estimated from an Interval regression of the logarithm of household income, controlling for sex assigned at birth, age groups (18-24, 25-29, 30-34, …, 70-74), race and ethnicity, marital status, educational attainment, sectoral and occupational dummy variables, living in one of the 15 largest metropolitan statistical areas (metro areas), as well as state and survey wave fixed effects. The error bars depict 95% confidence intervals. This means that we can be 95% confident that the true value lies within the range of the error bar. In other words, if the error bar crosses the x-axis, then the percentage point difference cannot be deemed as statistically different from 0 (at least not at this 95% confidence level). Standard errors robust to heteroscedasticity. Person-level weights used. See Box 3.1 for more details on Interval regression methodology.
Source: Household Pulse Survey (14 September 2022 – 10 July 2023).
The labour earnings penalty for LGBTI+ individuals is nearly twice as high among AFAB than AMAB individuals, as illustrated in Figure 3.13. Conversely, this penalty decreases with age, regardless of sex assigned at birth, a trend depicted in Figure 3.14. The significant labour earning disparity between AFAB and AMAB individuals can be attributed to a more pronounced penalty for cisgender LGB+ females compared to cisgender LGB+ males (who experience a non-significant penalty). This higher penalty for cisgender LGB+ females is driven by a higher representation of cisgender bisexuals and cisgender other non-heterosexuals, who, on average, experience a more pronounced income penalty than cisgender homosexuals (Figure 3.6). Additionally, the reduction of the labour earnings penalty with age aligns with the patterns previously presented in Figure 3.7, which analysed how income disparities for LGBTI+ individuals evolve across cohorts. This trend supports the hypothesis of a non-disclosure bias among employed LGBTI+ adults, suggesting that older generations from more privileged backgrounds may be more inclined to openly identify as LGBTI+ that those from less privileged backgrounds. It may also indicate a health selection process, wherein LGBTI+ adults who have reached an older age are more likely to come from advantaged backgrounds conducive to better navigating the significant health challenges that disproportionately affect the LGBTI+ population (Fredriksen-Goldsen et al., 2014[69]). Importantly, the fact that the income penalty for employed LGBTI+ individuals living alone is maximal among younger generations (10% on average across AMAB and AFAB individuals) suggests that this penalty is mainly capturing gaps in labour earnings, not in unearned income (e.g. dividends and property gains). Indeed, the share of unearned income increases with age.6

Note: The percentage differences are estimated from an Interval regression of the logarithm of household income, controlling for age groups (18-24, 25-29, 30-34, …, 70-74), race and ethnicity, marital status, educational attainment, sectoral and occupational dummy variables, living in one of the 15 largest metropolitan statistical areas (metro areas), as well as state and survey wave fixed effects. The error bars depict 95% confidence intervals. This means that we can be 95% confident that the true value lies within the range of the error bar. In other words, if the error bar crosses the x-axis, then the percentage point difference cannot be deemed as statistically different from 0 (at least not at this 95% confidence level). Standard errors robust to heteroscedasticity. Person-level weights used. See Box 3.1 for more details on Interval regression methodology.
Source: Household Pulse Survey (14 September 2022 – 10 July 2023).


The percentage differences are estimated from an Interval regression of the logarithm of household income, controlling for age groups, race and ethnicity, marital status, educational attainment, sectoral and occupational dummy variables, living in one of the 15 largest metropolitan statistical areas (metro areas), as well as state and survey wave fixed effects. The error bars depict 95% confidence intervals. This means that we can be 95% confident that the true value lies within the range of the error bar. In other words, if the error bar crosses the x-axis, then the percentage point difference cannot be deemed as statistically different from 0 (at least not at this 95% confidence level). Standard errors robust to heteroscedasticity. Person-level weights used. See Box 3.1 for more details on Interval regression methodology.
Source: Household Pulse Survey (14 September 2022 – 10 July 2023).
It is important to emphasise that the unexplained labour earnings penalty we report for LGBTI+ individuals likely understates the actual impact of labour market discrimination, whether it manifests directly or indirectly, such as through strategies individuals adopt to avoid discrimination. Indeed, many of these strategies negatively impact the labour market trajectories of LGBTI+ individuals. For instance, while concealing one’s identity can provide immediate protection, not being able to bring one’s whole self to work can impede career advancement in various ways (Section 3.2.2). Similarly, several LGBTI+ individuals opt for sectors and occupations they perceive as less hostile to their identities, such as male-dominated occupations for gay men. On average, this sorting seems to lead both AMAB and AFAB individuals to settle for lower-paying jobs (Box 3.3). As an illustration, without accounting for this intentional job selection, the labour earnings penalty would be 7% for LGBTI+ individuals assigned male at birth and 11% for those assigned female at birth, compared to 4% and 9%, respectively, when considering the impact of sectoral and occupational sorting. Overall, the gap reported in Figure 3.12 would be 10%, as opposed to 7% currently (Annex Figure 3.A.3). In addition, the gap becomes significant for cisgender LGB+ AMAB individuals.
Finally, the labour earnings penalty for LGBTI+ individuals hides both reduced hours worked and reduced hourly wages. This insight comes from our analysis of the Gallup US Daily Survey, which, in addition to household income, captures the typical number of hours worked in a week. From this data, we conclude that employed LGBT individuals living alone typically work one hour less per week, even after accounting for differences in demographics, sectors, and occupations. However, this discrepancy in hours accounts for only 25% of the labour earnings penalty for LGBT individuals, indicating that discrimination in hourly wage is also a significant factor.7
LGBTI+ individuals often avoid jobs where they anticipate facing discrimination. Using data from the Australian Twin Registers, a study compares gay men and lesbians with their monozygotic heterosexual twins, which allows controlling for both genetic factors as well as environmental factors common to both twins in each twin pair. The study also considers a large set of additional environmental factors that differs across twins in the same family. The results show that gay men and lesbians steer clear of occupations where they expect a high degree of hostility due to their sexual orientation, which is a pattern not observed among their heterosexual twins (Plug, Webbink and Martin, 2014[70])
Data from the United States confirm that gay men and lesbians tend to choose gender-atypical occupations. Specifically, gay men are overrepresented in female-dominated occupations, while lesbians are overrepresented in male-dominated occupations (Ueno, Roach and Pena-Talamantes, 2013[71]; Black, Sanders and Taylor, 2007[72]). Supporting these previous findings, the 2022 survey by the Center for American Progress shows that 36% of LGBTI+ respondents reported making decisions about where to work to avoid discrimination (Medina and Mahowald, 2023[16]).
Consistent with this body of research, data from the Household Pulse Survey (HPS) confirm that occupational sorting is at play among employed LGBTI+ individuals living alone. This is particularly the case for LGBTI+ assigned male at birth who are 34% less likely than their cisgender straight peers to work in occupations that are male dominated, i.e. Agriculture, Forestry, Fishing and Hunting, Mining, Quarrying, and Oil and Gas Extraction, Utilities, Construction, Manufacturing, Wholesale Trade, Transportation and Warehousing, Information Technology, and Waste Management and Remediation Services. In contrast, LGBTI+ individuals assigned female at birth are 9% less likely than cisgender straight women to work in occupations that are female dominated, i.e. Administrative and Support Services, Educational Services, Health Care, and Social Assistance.1 The HPS data offer further insights by allowing for an exploration of sectoral sorting. Findings show that both AMAB and AFAB LGBTI+ individuals have a higher likelihood of working as self-employed – potentially to escape discrimination from employers – or working in non-profit organisations – potentially within an activist framework promoting LGBTI+ equality – or working in government sectors, in a context where public administrations in OECD countries have been more proactive in establishing comprehensive diversity strategies compared to the private sector (OECD, 2020[73]).
Overall, the HPS data suggest that the sectoral and occupational sorting of LGBTI+ individuals result in lower pay. When accounting for this intentional job selection, the labour earnings penalty for LGBTI+ individuals living alone stands at 7%. However, when the effects of sectoral and occupational sorting are ignored, this penalty worsens to reach 10%.
← 1. This is computed from 22 categories from the occupation survey question (asked only from week 49 onwards: 14 September 2022 – 10 July 2023): “What kind of business, industry, or organisation is this? That is, what do they make or do where you work?”. Occupations dominated by males are defined by having a share equal or lower of 33% of females. Occupations dominated by females are defined by having a share equal or higher than 66% of females. Regressions results are qualitatively similar when using as a threshold 25% or 50%, instead of 33%.
This section first provides an overview of previous research on the impact of stigma and other drivers on LGBTI+ individuals’ health and well-being disparities. It then exploits HPS and Gallup data to compare health and well-being outcomes, by sexual orientation and gender identity.
3.5.1. The impact of stigma and other related mechanisms on the health and well-being of LGBTI+ individuals
Extensive research based on representative survey data has documented widespread health and well-being disparities within the LGBTI+ population. These disparities manifest themselves primarily through poorer mental health outcomes, such as low self-esteem, anxiety, and depression. Additionally, they often extend to behavioural health issues like sleep disorders and substance abuse, as well as physical health problems, including cardiovascular diseases and certain types of cancers. Prior research also indicates a higher risk of mortality among the LGBTI+ population, notably stemming from increased rates of suicidal ideation and suicide attempts (National Academies of Sciences, Engineering, and Medicine, 2020[37]; OECD, 2019[1]; Valfort, 2017[3]).
These health disparities are suspected to arise from the pervasive exposure of LGBTI+ individuals to stigma, in a society that predominantly views heterosexuality and cisgender identity as the norm. Consequently, LGBTI+ individuals experience a unique form of stress not encountered by their heterosexual and cisgender peers, often referred to as “minority stress” (Meyer, 2003[74]).
Several studies relying on US data confirm that a decrease in societal stigma leads to reduced psychological distress, and vice versa. For instance, the reduction in the gap between heterosexual and LGB youth’s suicide attempts was substantially higher in states that adopted same-sex marriage before its legalisation by the Supreme Court in 2015, than in others – a trend that was not apparent before the enactment of LGB-inclusive policies. Overall, it is estimated that same-sex marriage laws caused a reduction by nearly 15% of suicide attempts among adolescents who self-identify as gay, lesbian or bisexual (Raifman et al (2017[75]) – see (Carpenter et al., 2021[76]) for consistent results). Furthermore, bans on conversion therapy have been linked to improved mental health and decreased suicide rates (Harrell, 2022[77]). On the flip side, there is emerging evidence that the backlash against the expansion of LGBTI+ rights is harming this population’s health. Starting in 2015, the United States has seen a steady increase in anti-LGBTI+ bills, from 115 bills introduced in 2015, to over 500 in 2023 (Human Rights Campaign Foundation, 2023[78]). As of 2024, more than 150 such bills have become law (Trans Legislation Tracker, 2024[79]). Most of these laws aim to ban gender-affirming care for LGBTI+ youth, a treatment to alleviate the distress of non-cisgender individuals, often termed “gender dysphoria”, arising from a mismatch between biological sex and gender identity (Mann, Campbell and Nguyen, 2023[80]). These bans not only hinder the well-being of transgender and non-binary youth (Abreu et al., 2022[81]) but also perpetuate stigmatisation, affecting the broader LGBTI+ adult population (Mann, Campbell and Nguyen, 2023[80]). Indeed, hate crime victimisation of LGBTI+ people prevails (Flores et al., 2022[82]), and recent FBI statistics show it has intensified over the last years (FBI, 2023[83]). According to the 2022 survey by the Centre for American Progress, 51% of LGBTI+ adults reported that recent debates on state laws restricting LGBTI+ rights negatively impacted their mental health or safety. A staggering 86% of transgender or nonbinary individuals felt the same way. Yet, given that this latter group represents only a minority within the broader LGBTI+ population, they alone cannot account for the high share of LGBTI+ adults saying their mental health was affected. This suggests that the detrimental effects of gender-affirming care bans extend beyond just the well-being of those directly targeted by such bans (Medina and Mahowald, 2023[16]).
In addition to stigma, discrimination from medical practitioners likely exacerbates the health disparities faced by the LGBTI+ population. In the United States, a pervasive implicit bias against lesbian women and gay men has been identified among heterosexual healthcare providers (Sabin, Riskind and Nosek, 2015[84]). This conclusion is echoed by the first audit field experiment examining discrimination in access to mental health care, focusing on two characteristics of the patients: their race/ethnicity and their gender identity (Fumarco et al., 2020[85]). In this “simulated patients” study, appointment requests for common mental health concerns (such as anxiety, depression, and stress) were sent by email to various mental health providers in the United States, including psychologists, counsellors, social workers, and psychiatrists, using a popular online platform. The results highlighted significant discrimination against transgender and non-binary patients, especially when their names signalled a racial/ethnic minority background, like being African American or Hispanic. In line with these findings, the 2022 survey by the Center for American Progress showed that one-third of LGBTI+ adults experienced some form of mistreatment when interacting with a mental health professional in the past year. This rate rises to 4 in 10 for LGBTI+ people of colour and over half for transgender or nonbinary individuals. More generally, over 1 in 5 LGBTI+ adults reported either postponing or avoiding necessary medical care (23%) and preventive screenings (21%) within the past year, due to disrespect or discrimination from providers. In contrast, only 7% of non-LGBTI+ individuals reported similar experiences for both medical care and preventive screenings, which is more than three times less (Medina and Mahowald, 2023[16]).
Poorer health outcomes for LGBTI+ individuals might also be reinforced by the more limited financial resources they can allocate to healthcare services. Consistent with their income penalty (Section 3.3), more than 1 in 3 LGBTI+ respondents to the 2022 survey by the Center for American Progress declared having postponed or not searched for necessary medical care and preventive screenings due to cost issues. In contrast, financial barriers to accessing healthcare were reported by only 1 in 5 non-LGBTI+ respondents (Medina and Mahowald, 2023[16]). On a positive note, the negative impact of LGBTI+ individuals’ economic vulnerability on their access to healthcare has likely diminished over the past decade due to two key milestones. The first was the implementation of the major provisions of the Affordable Care Act in 2014. This notably expanded Medicaid eligibility and led to a halving of the uninsured population by 2016. The second milestone was the legalisation of same-sex marriage by the Supreme Court in 2015. This allowed for the expansion of access to a spouse or partner’s employer-sponsored insurance for LGBTI+ adults. LGBTI+ individuals disproportionately benefited from these changes, leading to a significant reduction in their health coverage disparities (Bolibol et al., 2023[86]).
3.5.2. Comparing health and well-being outcomes by sexual orientation and gender identity
This section explores health and well-being gaps between LGBTI+ and non-LGBTI+ individuals. Two outcomes are analysed: mental health, as proxied in the Household Pulse Survey by the probability of showing symptoms of generalised anxiety or major depressive disorder, and a multidimensional measure of well-being stemming from the Gallup US Daily Survey.
Unexplained gaps in mental health between LGBTI+ and non-LGBTI+ individuals
In 2023, LGBTI+ Americans reported symptoms of mental health disorders at a rate of 53%, making them 80% more likely than their non-LGBTI+ peers to be at risk of generalised anxiety or major depressive disorder, as illustrated in Panel A of Figure 3.15– for a description of how this risk is measured, see Box 3.4. In line with prior research, this mental health penalty was most pronounced among non-cisgender individuals. Their risk is more than double that of cisgender straight American adults, largely due to the larger health challenges faced by transgender individuals. Although gay men and lesbians had the smallest disparity within the LGBTI+ group, they were still, on average, nearly 40% more likely to experience mental health issues than their cisgender straight peers. Adjusting for essential demographic differences slightly narrows these gaps, but the overall patterns remain unchanged (Panel B of Figure 3.15).8
The Household Pulse Survey asks four questions to assess the mental health of the respondent, which were developed in partnership with the National Center for Health Statistics.
Two of these questions measure symptoms of anxiety: (i) “Over the last 2 weeks, how often have you been bothered by feeling nervous, anxious, or on edge?”; and (ii) “Over the last 2 weeks, how often have you been bothered by not being able to stop or control worrying?”.
The other two questions measure symptoms of depression: (i) “Over the last 2 weeks, how often have you been bothered by feeling down, depressed, or hopeless?”; and (ii) “Over the last 2 weeks, how often have you been bothered by having little interest or pleasure in doing things?”.
For each question, the answers are assigned a numerical value (nearly every day = 3, more than half the days = 2, several days = 1, and not at all = 0). It is considered that respondents show symptoms of generalised anxiety disorder when the sum of the numerical values associated with their answers to the two “anxiety” questions is greater than three, in which case individuals are at a heightened risk of being diagnosed with a generalised anxiety disorder. Following the same logic, it is considered that respondents show symptoms of major depressive disorder when the sum of the numerical values associated with their answers to the two “depression” questions is greater than three, in which case individuals are at a heightened risk of being diagnosed with a major depressive disorder (National Center for Health Statistics, 2023[87]).


Note: The percentage differences are estimated from a Logistic regression, controlling for sex assigned at birth, age groups (18-24, 25-29, 30-34, …, 80-84, 85-88), race and ethnicity, marital and parental status, number of adults in the household, educational attainment, living in one of the 15 largest metropolitan statistical areas (metro areas), as well as state and survey wave fixed effects. The percentage point differences are estimated at the average of the covariates. The error bars depict 95% confidence intervals. This means that we can be 95% confident that the true value lies within the range of the error bar. In other words, if the error bar crosses the x-axis, then the percentage point difference cannot be deemed as statistically different from 0 (at least not at this 95% confidence level). Standard errors robust to heteroscedasticity. Person-level weights used.
Source: Household Pulse Survey (4 January 2023 – 10 July 2023) for Panel A. Household Pulse Survey (21 July 2021 – 10 July 2023) for Panel B.
The mental health penalty does not differ based on sex assigned at birth, as illustrated in Figure 3.16. Additionally, the previously observed trend, in which the disparities for LGBTI+ individuals diminish with age, is consistent in the context of mental health, as shown in Figure 3.17. Finally, the mental health differences between LGBTI+ and cisgender straight adults remain consistent, regardless of whether an individual lives alone or with a partner, suggesting that being in a relationship does little to mitigate the negative effects of minority stress.9

Note: The percentage differences are estimated from a Logistic regression, controlling for age groups (18-24, 25-29, 30-34, …, 80-84, 85-88), race and ethnicity, marital and parental status, number of adults in the household, educational attainment, living in one of the 15 largest metropolitan statistical areas (metro areas), as well as state and survey wave fixed effects. The percentage point differences are estimated at the average of the covariates. The error bars depict 95% confidence intervals. This means that we can be 95% confident that the true value lies within the range of the error bar. In other words, if the error bar crosses the x-axis, then the percentage point difference cannot be deemed as statistically different from 0 (at least not at this 95% confidence level). Standard errors robust to heteroscedasticity. Person-level weights used.
Source: Household Pulse Survey (21 July 2021 – 10 July 2023).

Note: The percentage differences are estimated from a Logistic regression, controlling for age groups, race and ethnicity, marital and parental status, number of adults in the household, educational attainment, living in one of the 15 largest metropolitan statistical areas (metro areas), as well as state and survey wave fixed effects. The percentage point differences are estimated at the average of the covariates. The error bars depict 95% confidence intervals. This means that we can be 95% confident that the true value lies within the range of the error bar. In other words, if the error bar crosses the x-axis, then the percentage point difference cannot be deemed as statistically different from 0 (at least not at this 95% confidence level). Standard errors robust to heteroscedasticity. Person-level weights used.
Source: Household Pulse Survey (21 July 2021 – 10 July 2023).
Comparing mental health responses from both the Gallup US Daily Survey (2012-17) and the Gallup Panel – COVID-19 Survey (2020) reveals a substantial negative impact of the COVID-19 pandemic on the mental well-being of Americans, particularly among LGBTI+ individuals – a trend corroborated by previous research (OECD, 2021[31]; OECD, 2021[88]; OECD, 2021[89]). Before the pandemic, even after adjusting for essential demographic characteristics, LGBT adults were, in comparison to their non-LGBT peers, 4% less likely to experience enjoyment and 31% and 24% more likely to feel worried and stressed, respectively. However, with the onset of the pandemic, all three mental health indicators deteriorated, as depicted in Figure 3.18. Several factors could explain the widening of mental health disparities between LGBTI+ individuals and their cisgender straight peers during the COVID-19 crisis. These include pre-existing higher rates of mental health issues within the LGBTI+ population, potentially making them more susceptible to pandemic-related stress. Additionally, COVID-19 containment measures, such as social distancing and lockdowns, imposed unique challenges on LGBTI+ individuals, such as isolation from chosen families or forced cohabitation with unsupportive biological family members, further exacerbating mental health gaps.

Note: The percentage point differences are estimated from a Logistic regression, controlling for sex assigned at birth, age groups (18-24, 25-29, 30-34, …, 80-84, 85-88), race and ethnicity, partnership and parental status, number of adults in the household, educational attainment, as well as state, year, and month fixed effects. The percentage point differences are estimated at the average of the covariates. The error bars depict 95% confidence intervals. This means that we can be 95% confident that the true value lies within the range of the error bar. In other words, if the error bar crosses the x-axis, then the percentage point difference cannot be deemed as statistically different from 0 (at least not at this 95% confidence level). Standard errors robust to heteroscedasticity. Person-level weights used.
Source: Gallup US Daily Survey (2012-17) and Gallup Panel – COVID-19 Survey (March – December 2020).
Unexplained gaps in well-being between LGBTI+ and non-LGBTI+ individuals
From 2014 to 2017, the Gallup US Daily Survey introduced several questions, as detailed in Box 3.5, to construct the multidimensional Gallup National Health and Well-Being Index. These questions were categorised into five components, subsequently aggregated into a global index, aimed at capturing key determinants of well-being: (i) the community one lives in; (ii) sense of purpose; (iii) social environment; (iv) financial situation; and (v) mental, behavioural and physical health.
Analysis of these data reveals significant unexplained well-being disparities between LGBT and non-LGBT individuals (Figure 3.19). On average, LGBT adults had a 4 percentage points (7%) lower overall well-being, with noticeable deficits across all five components of the index. Notably, the financial (7 percentage points, 11%) and health (4 percentage points, 7%) penalties of LGBT adults emerged as major contributors to their reduced well-being.

Note: The percentage point differences are estimated from an OLS regression, controlling for sex assigned at birth, age groups (18-24, 25-29, 30-34, …, 80-84, 85-88), race and ethnicity, partnership and parental status, number of adults in the household, educational attainment, as well as state, year, and month fixed effects. The error bars depict 95% confidence intervals. This means that we can be 95% confident that the true value lies within the range of the error bar. In other words, if the error bar crosses the x-axis, then the percentage point difference cannot be deemed as statistically different from 0 (at least not at this 95% confidence level). Standard errors robust to heteroscedasticity. Person-level weights used.
Source: Gallup US Daily Survey (2014-17).
The questions included in each of the five components of the Gallup National Health and Well-Being Index are as follows:
The community one lives in: “I can’t imagine living in a better community than the one I live in today”, “I am satisfied with the city or area where I live”, “The city or area where I live is a perfect place for me”, “I am proud of my community (or the area where I live)”, “I always feel safe and secure”, “The house or apartment that I live in is ideal for me and my family”, “In the last 12 months, I have received recognition for helping to improve the city or area where I live”.
Sense of purpose: “There is a leader in my life who makes me enthusiastic about the future”, “I like what I do every day”, “In the past 12 months, I have reached most of my goals”, “I get to use my strengths to do what I do best every day”, “I learn or do something interesting every day”.
Social environment: “My relationship with my spouse, partner, or closest friend is stronger than ever”, “I always make time for regular trips or vacations with friends and family”, “Someone in my life always encourages me to be healthy”, “My friends and family give me positive energy every day”.
Financial situation: “There were no occasions in the past 12 months when I did not have enough money to buy food that I or my family needed”, “I have enough money to do everything I want to do”, “In the last seven days, I have not worried about money”, “There were no occasions in the past 12 months when I did not have enough money to pay for healthcare and/or medicines that I or my family needed”, “Compared to the people I spend time with, I am satisfied with my standard of living”.
Mental, behavioural and physical health: “I never use drugs or medication (including prescription drugs) which affect my mood or help me relax”, “My physical health is near-perfect”, “I have no health problems that prevent me from doing any of the things people my age normally can do”, “I didn’t experience physical pain yesterday”, “My healthcare provider didn’t tell me that I have any restrictions (on the amount or type of exercise I can do) that would limit my ability to exercise”, “Over the last two weeks, I have not been bothered by little interest or pleasure in doing things”, “In the last seven days, I have felt active and productive every day”, “I have never been told by a physician or nurse that I have any of the following (High Blood Pressure, High Cholesterol, Diabetes, Depression, Heart Attack, Asthma, Cancer)”, “I don’t have any other health problems or conditions”, “A doctor would say that I do a great job of managing my health”, “Days w/ 5 servings of fruits/veggies”, “Days w/ 30 min-plus exercise”, “I ate healthy all day yesterday”, “I always feel good about my physical appearance”, “I have little to no alcoholic drinks in a typical week (Note: One drink is equal to one beer, one glass of wine, one shot of liquor, or one mixed drink)”, “I don’t smoke”, “I don’t use any of the following tobacco products (cigarettes, cigars, pipe, smokeless tobacco, chew or snuff, other)”. In addition to these questions, the height and weight of the respondent are combined into a Body Mass Index that also enters the creation of the health component of the Gallup National Health and Well-Being Index.
Source: Gallup Inc.
References
[81] Abreu, R. et al. (2022), “Impact of gender-affirming care bans on transgender and gender diverse youth: Parental figures’ perspective”, J Fam Psychol. 2022 Aug;36(5):643-652, https://doi.org/10.1037/fam0000987.
[91] Aksoy, B. and I. Chadd (2023), Gender, Sexual Identity, and Competitiveness, SSRN 4362469 2023.
[66] Aksoy, C., C. Carpenter and J. Frank (2018), “Sexual Orientation and Earnings: New Evidence from the United Kingdom”, ILR Review, 71(1), 242-272, https://doi.org/10.1177/0019793916687759.
[65] Aksoy, C. et al. (2019), “Gay glass ceilings: Sexual orientation and workplace authority in the UK”, Journal of Economic Behavior & Organization, Vol. 159, pp. 167-180, https://doi.org/10.1016/j.jebo.2019.01.013.
[26] Badgett, M. (2018), Left out? Lesbian, gay, and bisexual poverty in the U.S., Population Research and Policy Review, 37(5), 667–702.
[42] Badgett, M. (2014), The Economic Cost of Stigma and the Exclusion of LGBT People: A Case Study of India, Washington, D.C. : World Bank Group, http://documents.worldbank.org/curated/en/527261468035379692/The-economic-cost-of-stigma-and-the-exclusion-of-LGBT-people-a-case-study-of-India.
[57] Badgett, M. (1995), The wage effects of sexual-orientation discrimination, Industrial and Labor Relations Review, 48(4), 726–739.
[25] Badgett, M., C. Carpenter and A. Sansone (2021), “LGBTQ Economics”, Journal of Economic Perspectives, 35 (2): 141-70, pp. 141-70.
[28] Badgett, M., S. Choi and B. Wilson (2019), LGBT Poverty in the United States: A Study of Differences between Sexual Orientation and Gender Identity Groups, Los Angeles, CA: Williams Institute, UCLA School of Law.
[52] Bardales, N. (2013), “Finding a Job in a Beard and a Dress: Evaluating the Effectiveness of Transgender AntiDiscrimination Laws”, http://www.semanticscholar.org/paper/Finding-a-Job-in-%E2%80%9C-a-Beard-and-a-Dress-%E2%80%9D-%3A-the-of-%E2%88%97-Bardales/b260619b3c78c224663689a6aae11785ed4aedde.
[48] Baumle, A., M. Badgett and S. Boutcher (2019), New research on sexual orientation and gender identity discrimination: Effect of state policy on charges filed at the EEOC, Journal of Homosexuality, 67(8), 1135–1144.
[4] Bettinsoli, M., A. Suppes and J. Napier (2020), Predictors of Attitudes Toward Gay Men and Lesbian Women in 23 Countries, Social Psychological and Personality Science, 11(5), 697–708, https://doi.org/10.1177/1948550619887785.
[72] Black, D., S. Sanders and L. Taylor (2007), “The economics of lesbian and gay families”, Journal of Economic Perspectives 21(2): 53-70.
[86] Bolibol, A. et al. (2023), “Health Insurance Coverage And Access To Care Among LGBT Adults, 2013–19”, Health Affairs, Vol. 42/6, pp. 858-865, https://doi.org/10.1377/hlthaff.2022.01493.
[18] Brown, A. (2019), “Bisexual adults are far less likely than gay men and lesbians to be ‘out’ to the people in their lives”, Pew Research Center, https://www.pewresearch.org/short-reads/2019/06/18/bisexual-adults-are-far-less-likely-than-gay-men-and-lesbians-to-be-out-to-the-people-in-their-lives/.
[49] Bryant-Lees, K. and M. Kite (2021), “Evaluations of LGBT job applicants: consequences of applying “out””, Equality, Diversity and Inclusion, Vol. 40 No. 7, pp. 874-891.
[90] Buser, T., L. Geijtenbeek and E. Plug (2014), Sexual orientation, competitiveness and income, Journal of Economic Behavior & Organization, 2018, 151, 191-198.
[64] Business, B. (ed.) (2024), Breaking the Rainbow Ceiling: How LGBTQ+ people can thrive and succeed at work.
[76] Carpenter, C. et al. (2021), “Effects of Access to Legal Same-Sex Marriage on Marriage and Health”, J. Pol. Anal. Manage., 40: 376-411, https://doi.org/10.1002/pam.22286.
[29] Carpenter, C., S. Eppink and G. Gonzalez (2020), Transgender status, gender identity, and socioeconomic outcomes in the United States, Industrial & Labor Relations Review, 73(3), 573-599.
[23] Carpenter, C., M. Lee and L. Nettuno (2022), Economic outcomes for transgender people and other gender minorities in the United States: First estimates from a nationally representative sample, Southern Economic Journal Volume89, Issue2.
[27] Chai, L. and M. Maroto (2019), Economic insecurity among gay and bisexual men: Evidence from the 1991–2016 U.S. General Social Survey, Sociological Perspectives, 63(1), 50–68.
[40] Choi, S. et al. (2015), “Serving our youth 2015: The needs and experiences of Lesbian, Gay, Bisexual,Transgender, and Questioning youth experiencing homelessness”, The Williams Institute with True Colors Fund..
[12] Coffman, K., L. Coffman and K. Marzilli (2024), Non-Binary Gender Economics, National Bureau of Economic Research.
[35] D’Ippoliti, C. and F. Botti (2017), “Sex Work among Trans People: Evidence from Southern Italy”, Feminist Economics, Vol. 23/3, pp. 77-109, https://doi.org/10.1080/13545701.2016.1177656.
[68] Dawson, L., A. Kirzinger and J. Kates (2021), “The Impact of the COVID-19 Pandemic on LGBT People”, KFF, https://www.kff.org/coronavirus-covid-19/poll-finding/the-impact-of-the-covid-19-pandemic-on-lgbt-people/?utm_campaign=KFF-2021-polling-surveys&utm_medium=email&_hsmi=115337308&_hsenc=p2ANqtz--3JuXAA0nFrNGiIJMeNLmylXdGcM2uJ28qSTQK1PdiROsr_PSGkIt1SBDp9qGoV.
[46] Dillbary, J. and E. Griffin (2019), “An Empirical Analysis of Sexual Orientation Discrimination”, University of Chicago Law Review: Vol. 86: Iss. 1, Article 4, https://chicagounbound.uchicago.edu/uclrev/vol86/iss1/4.
[5] Doan Van, E. et al. (2019), Perceived Discrimination, Coping Mechanisms, and Effects on Health in Bisexual and Other Non-Monosexual Adults., Arch Sex Behav 48, 159–174, https://doi.org/10.1007/s10508-018-1254-z.
[7] Dodge, B. et al. (2016), Attitudes toward bisexual men and women among a nationally representative probability sample of adults in the United States, PLoS One, 11(10), e0164430.
[58] Drydakis, N. (2022), “Sexual orientation and earnings: A meta-analysis 2012-2020”, Journal of Population Economics 35: 409-440.
[38] Dunne, G., S. Prendergast and D. Telford (2002), “Young, gay, homeless and invisible: A growing population?”, Culture, Health and Sexuality 4(1): 103-115.
[6] Dyar, C. and B. Feinstein (2018), Binegativity: Attitudes toward and stereotypes about bisexual individuals, In D. J. Swan & S. Habibi (Eds.), Bisexuality: Theories, research, and recommendations for the invisible sexuality (pp. 95–111). Springer International Publishing, https://doi.org/10.1007/978-3-319-71535-3_6.
[83] FBI (2023), “Hate Crime in the United States Incidence Analysis”, https://cde.ucr.cjis.gov/LATEST/webapp/#/pages/explorer/crime/hate-crime.
[2] Flores, A. (2021), Social Acceptance of LGBTI People in 175 Countries and Locations: 1981 to 2020, UCLA Williams Institute.
[82] Flores, A. et al. (2022), “Hate crimes against LGBT people: National Crime Victimization Survey, 2017-2019”, PLoS One. 2022 Dec 21;17(12), https://doi.org/10.1371/journal.pone.0279363.
[17] Folch, M. (2022), The LGBTQ+ Gap: Recent Estimates for Young Adults in the United States, https://doi.org/10.2139/ssrn.4072893.
[69] Fredriksen-Goldsen, K. et al. (2014), “Successful Aging Among LGBT Older Adults: Physical and Mental Health-Related Quality of Life by Age Group”, The Gerontologist, Vol. 55/1, pp. 154-168, https://doi.org/10.1093/geront/gnu081.
[85] Fumarco, L. et al. (2020), “Gender Identity, Race, and Ethnicity-based Discrimination in Access to Mental Health Care: Evidence from an Audit Correspondence Field Experiment”, National Bureau of Economic Research, Working Paper Series 28164, https://doi.org/10.3386/w28164.
[63] Giddings, L. et al. (2014), “Birth cohort and the specialization gap between same-sex and different-sex couples”, Demography 51(2): 509-534.
[14] GLAAD (2023), Where We Are on TV (2022-2023), Technical Report, GLAAD Media Institute, New York (2023).
[77] Harrell, B. (2022), “Conversion Therapy Bans, Suicidality, and Mental Health”, https://static1.squarespace.com/static/5f0df932fe24d51944633598/t/636a767467ca3d1c62923e1e/1667921524648/Conversion+Therapy+Bans%2C+Suicidality%2C+and+Mental+Health_10.10.22.pdf.
[13] Hegarty, P. and A. Smith (2023), “Public understanding of intersex: an update on recent findings”, Int J Impot Res. 2023 Feb;35(1):72-77, https://doi.org/10.1038/s41443-021-00485-w.
[9] Herek, G. et al. (2010), Demographic, Psychological, and Social Characteristics of Self-Identified Lesbian, Gay, and Bisexual Adults in a US Probability Sample, Sexuality Research and Social Policy 7 (3): 176–200.
[10] Hoffarth, M. et al. (2016), Development and validation of the Attitudes Towards Asexuals (ATA) scale, Psychology & Sexuality, https://doi.org/10.1080/19419899.2015.1050446.
[60] Hofmarcher, T. and E. Plug (2022), “Specialization in same-sex and different-sex couples”, Labour Economics, Vol. 77, p. 101995, https://doi.org/10.1016/j.labeco.2021.101995.
[78] Human Rights Campaign Foundation (2023), LGBTQ+ Americans Under Attack: A Report and Reflection on the 2023 State Legislative Session, Human Rights Campaign Foundation, https://hrc-prod-requests.s3-us-west-2.amazonaws.com/Anti-LGBTQ-Legislation-Impact-Report.pdf.
[21] Human Rights Campaign Foundation (2018), A workplace divided: understanding the climate for LGBTQ workers nationwide, https://www.hrc.org/resources/a-workplace-divided-understanding-the-climate-for-lgbtq-workers-nationwide.
[61] Jepsen, C. and L. Jepsen (2015), “Labor-Market Specialization within Same-Sex and Different-Sex Couples”, Industrial Relations: A Journal of Economy and Society, 54 (1), 2015, p. 109-130.
[43] Jepsen, C. and L. Jepsen (2009), “Does home ownership vary by sexual orientation?”, Regional Science and Urban Economics 39(3): 307–315.
[62] Jepsen, L. and C. Jepsen (2002), “An Empirical Analysis of the Matching Patterns of Same-Sex and Opposite-Sex Couples”, Demography, 39 (3), 2002, p. 435-453.
[59] Klawitter, M. (2015), Meta-analysis of the effects of sexual orientation on earnings, Industrial Relations, 54(1), 4–32, https://doi.org/10.1111/irel.12075.
[55] Kline, P., E. Rose and C. Walters (2024), A Discrimination Report Card, National Bureau of Economic Research, Cambridge, MA, https://doi.org/10.3386/w32313.
[54] Kline, P., E. Rose and C. Walters (2022), “Systemic Discrimination Among Large U.S. Employers”, The Quarterly Journal of Economics, Vol. 137/4, pp. 1963-2036, https://doi.org/10.1093/qje/qjac024.
[45] Leppel, K. (2007), “Home-ownership among opposite- and same-sex couples in the US”, Feminist Economics 13(1): 1-30.
[44] Leppel, K. (2007), “Married and unmarried, opposite- and same-sex couples: A decomposition of homeownership differences”, Journal of Housing Research 16(1): 61-81.
[11] MacInnis, C. and G. Hodson (2012), Intergroup bias toward “Group X”: Evidence of prejudice, dehumanization, avoidance, and discrimination against asexuals, Group Processes & Intergroup Relations, 15(6), 725–743.
[53] Make the Road New York (2010), “Transgender Need Not Apply: A Report on Gender Identity Job Discrimination”, Brooklyn, NY: Make the Road New York.
[80] Mann, S., T. Campbell and D. Nguyen (2023), “Access to Gender-Affirming Care and Transgender Mental Health: Evidence from Medicaid Coverage”, American Journal of Health Economics, https://doi.org/10.1086/728080.
[24] Martell, M. and L. Roncolato (2023), Economic Vulnerability of Sexual Minorities: Evidence from the US Household Pulse Survey, Popul Res Policy Rev. 2023;42(2):28.
[16] Medina, C. and L. Mahowald (2023), Discrimination and Barriers to Well-Being: The State of the LGBTQI+ Community in 2022, The Center for American Progress, https://www.americanprogress.org/article/discrimination-and-barriers-to-well-being-the-state-of-the-lgbtqi-community-in-2022/.
[30] Medina, C. and L. Mahowald (2021), “Key Issues Facing People With Intersex Traits”, The Center for American Progress, https://www.americanprogress.org/article/key-issues-facing-people-intersex-traits/.
[74] Meyer, I. (2003), Prejudice, social stress, and mental health in lesbian, gay and bisexual populations: conceptual issues and research evidence, Psychol Bull. 2003;129:674-697.
[19] Miller, A. (2018), “Searching for gaydar: Blind spots in the study of sexual orientation perception”, Psychology & Sexuality, Vol. 9/3, pp. 188-203, https://doi.org/10.1080/19419899.2018.1468353.
[51] Mishel, E. (2016), Discrimination against queer women in the U.S. workforce: A résumé audit study, Socius: Sociological Research for a Dynamic World, 2, 1–13.
[33] Movement Advancement Project (2020), “The disproportionate impacts of COVID-19 on LGBTQ households in the U.S.”, http://www.lgbtmap.org/2020-covid-lgbtq-households.
[37] National Academies of Sciences, Engineering, and Medicine (2020), Understanding the Well-Being of LGBTQI+ Populations, Washington, DC: The National Academies Press, https://doi.org/10.17226/25877.
[87] National Center for Health Statistics (2023), U.S. Census Bureau, Household Pulse Survey, 2020–2023. Anxiety and Depression, https://www.cdc.gov/nchs/covid19/pulse/mental-health.htm.
[67] Neumark, D., I. Burn and P. Button (2019), “Is It Harder for Older Workers to Find Jobs? New and Improved Evidence from a Field Experiment”, Journal of Political Economy, Vol. 127/2, pp. 922-970, https://doi.org/10.1086/701029.
[20] O. Rule, N. and N. Ambady (2008), “Brief exposures: Male sexual orientation is accurately perceived at 50ms”, Journal of Experimental Social Psychology, Vol. 44/4, pp. 1100-1105, https://doi.org/10.1016/j.jesp.2007.12.001.
[31] OECD (2021), “COVID-19 and Well-being: Life in the Pandemic”, OECD Publishing, Paris, https://doi.org/10.1787/1e1ecb53-en.
[36] OECD (2021), “Fitter Minds, Fitter Jobs: From Awareness to Change in Integrated Mental Health, Skills and Work Policies”, Mental Health and Work, OECD Publishing, Paris, https://doi.org/10.1787/a0815d0f-en.
[89] OECD (2021), “Supporting young people’s mental health through the COVID-19 crisis”, OECD Policy Responses to Coronavirus (COVID-19), OECD Publishing, Paris, https://doi.org/10.1787/84e143e5-en.
[88] OECD (2021), “Tackling the mental health impact of the COVID-19 crisis: An integrated, whole-of-society response”, OECD Policy Responses to Coronavirus (COVID-19), OECD Publishing, Paris, https://doi.org/10.1787/0ccafa0b-en.
[73] OECD (2020), “All Hands In? Making Diversity Work for All”, OECD Publishing, Paris, https://doi.org/10.1787/efb14583-en.
[1] OECD (2019), Society at a Glance 2019: OECD Social Indicators, OECD Publishing, Paris, https://doi.org/10.1787/soc_glance-2019-en.
[22] Pachankis, J. et al. (2020), “Sexual Orientation Concealment and Mental Health: A Conceptual and Meta-Analytic Review”, Psychol Bull. 2020 Oct; 146(10): 831–871, https://doi.org/10.1037/bul0000271.
[15] Pew Research Center (2021), Rising shares of U.S. adults know someone who is transgender or goes by gender-neutral pronouns, Washington, DC: Pew Research Center, https://www.pewresearch.org/short-reads/2021/07/27/rising-shares-of-u-s-adults-know-someone-who-is-transgender-or-goes-by-gender-neutral-pronouns/.
[41] Pew Research Center (2013), “A Survey of LGBT Americans”, https://www.pewresearch.org/social-trends/2013/06/13/a-survey-of-lgbt-americans/.
[8] Pew Research Center (2013), “A Survey of LGBT Americans. Chapter 2: Social Acceptance”, https://www.pewresearch.org/social-trends/2013/06/13/chapter-2-social-acceptance/.
[70] Plug, E., D. Webbink and N. Martin (2014), “Sexual orientation, prejudice, and segregation”, Journal of Labor Economics 32(1): 123-159.
[56] Quillian, L., J. Lee and M. Oliver (2020), “Evidence from Field Experiments in Hiring Shows Substantial Additional Racial Discrimination after the Callback”, Social Forces, Vol. 99/2, pp. 732-759, https://doi.org/10.1093/sf/soaa026.
[75] Raifman, J. et al. (2017), Difference-in-Differences Analysis of the Association Between State Same-Sex Marriage Policies and Adolescent Suicide Attempts, JAMA Pediatr. 2017;171(4):350–356.
[39] Rew, L., R. Fouladi and R. Yockey (2002), “Sexual health practices of homeless youth”, Journal of Nursing Scholarship 34(2): 139-145.
[84] Sabin, J., R. Riskind and B. Nosek (2015), “Health Care Providers’ Implicit and Explicit Attitudes Toward Lesbian Women and Gay Men”, Am J Public Health. 2015 Sep;105(9):1831-41, https://doi.org/10.2105/AJPH.2015.302631.
[34] Schilt, K. and M. Wiswall (2008), “Before and after: Gender transitions, human capital, and workplace experiences”, The B.E. Journal of Economic Analysis and Policy 8:1 (2008): 1–28.
[47] Tate, D. and C. Patterson (2019), “Desire for Parenthood in Context of Other Life Aspirations Among Lesbian, Gay, and Heterosexual Young Adults”, Front Psychol. 2019 Nov 28;10:2679, https://doi.org/10.3389/fpsyg.2019.02679.
[50] Tilcsik, A. (2011), Pride and prejudice: Employment discrimination against openly gay men in the United States, American Journal of Sociology, 117(2), 586–626.
[79] Trans Legislation Tracker (2024), “2024 anti-trans bills tracker: Anti-trans bills under consideration and passed, 2021-2024”, Trans Legislation Tracker, https://translegislation.com/.
[71] Ueno, K., T. Roach and A. Pena-Talamantes (2013), “Sexual orientation and gender typicality of the occupation in young adulthood”, Social Forces 92(1): 81-108.
[3] Valfort, M. (2017), “LGBTI in OECD countries: A review”, OECD Social, Employment and Migration Working Papers, No. 198, OECD Publishing, Paris, https://doi.org/10.1787/d5d49711-en.
[32] Wenham, C. (2020), “The gendered impact of the COVID-19 crisis and post-crisis period”, European Parliament, Brussels, http://www.europarl.europa.eu/supporting-analyses.

Source: Gallup Poll Social Series (2004-23). Person-level weights used.
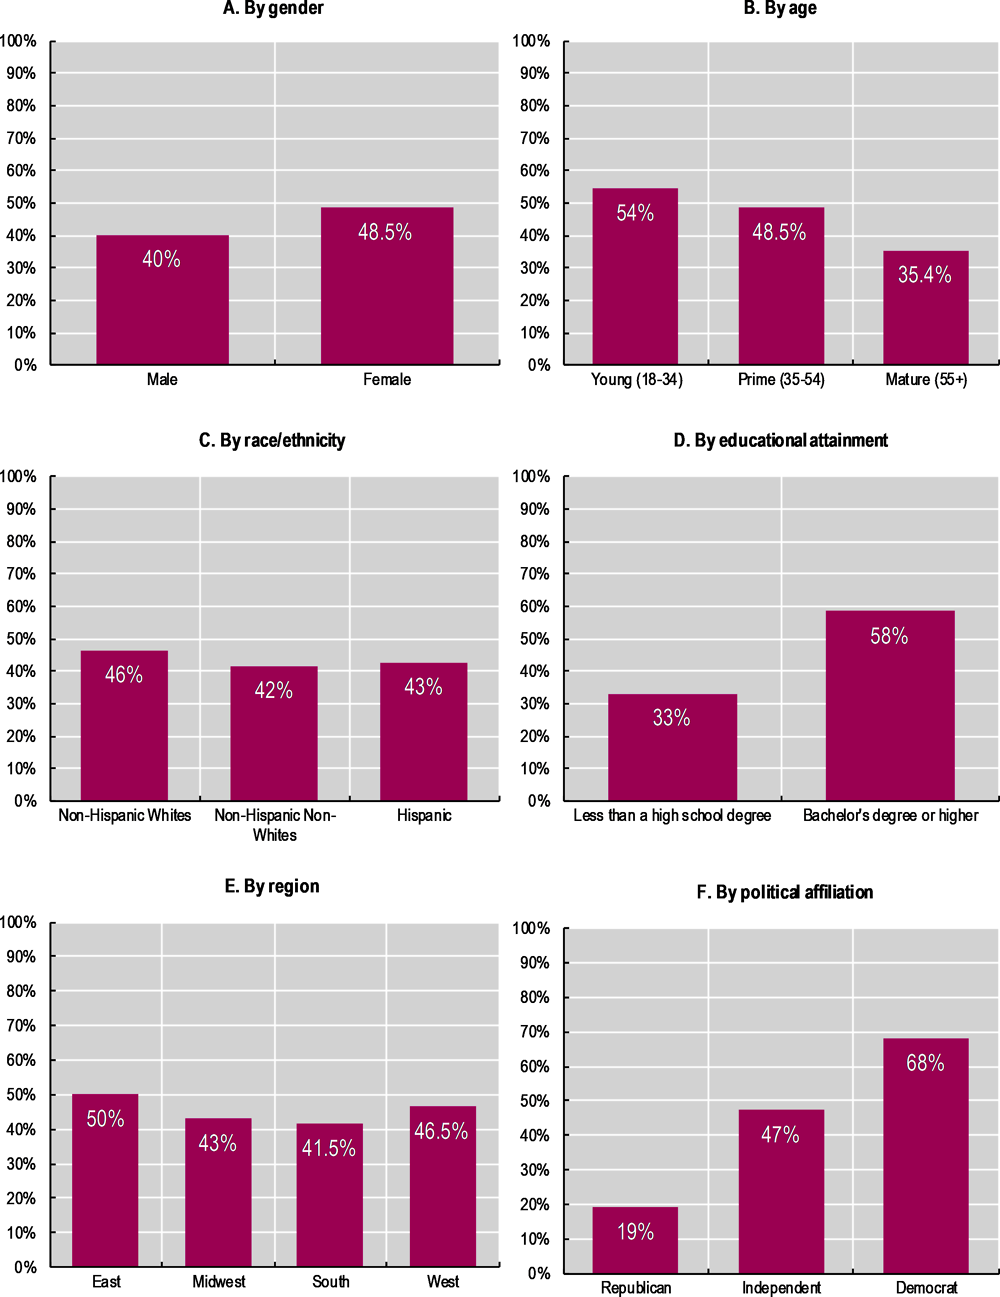
Source: Gallup Poll Social Series (2021 and 2023). Person-level weights used.

Note: The percentage differences are estimated from an Interval regression of the logarithm of household income, controlling for age groups (18-24, 25-29, 30-34, …, 70-74), race and ethnicity, marital status, educational attainment, living in one of the 15 largest metropolitan statistical areas (metro areas), as well as state and survey wave fixed effects. The error bars depict 95% confidence intervals. This means that we can be 95% confident that the true value lies within the range of the error bar. In other words, if the error bar crosses the x-axis, then the percentage point difference cannot be deemed as statistically different from 0 (at least not at this 95% confidence level). Standard errors robust to heteroscedasticity. Person-level weights used. See Box 3.1 for more details on Interval regression methodology.
Source: Household Pulse Survey (14 September 2022 – 10 July 2023).
Notes
← 1. YouGov is an international Internet-based market research and data analytics firm. Its methodology involves online opt-in panels, i.e. obtaining responses from an invited group of Internet users, and then weighting these responses so that the sample becomes nationally representative with respect to essential demographics.
← 2. Respondents are members of the Center’s American Trends Panel (ATP), an online survey panel that is recruited through national, random sampling of residential addresses. Thus, nearly all US adults have a chance of selection. The survey is weighted to be representative of the US adult population by gender, race, ethnicity, partisan affiliation, education and other categories. More about the ATP’s methodology: www.pewresearch.org/our-methods/u-s-surveys/the-american-trends-panel/.
← 3. Results available upon request.
← 4. The burgeoning field of behavioural economics focusing on LGBTI+ individuals reveals distinctive patterns in beliefs and preferences that can differentially influence their educational, labour market, financial, and health outcomes. For example, research by (Coffman, Coffman and Marzilli, 2024[12]) indicates that non-binary individuals exhibit lower levels of competitiveness, risk tolerance, and patience compared to men or women, and show less prosocial behaviour than women. Additionally, (Buser, Geijtenbeek and Plug, 2014[90]; Aksoy and Chadd, 2023[91]) suggest that gay men are less competitive than their straight counterparts. Although further research is necessary to fully understand the roots of these behavioural differences, it is plausible that the persistence of anti-LGBTI+ discrimination plays a considerable role in shaping these outcomes.
← 5. Results available upon request.
← 6. Source: U.S. Bureau of Labor Statistics (https://beta.bls.gov/dataQuery/search).
← 7. Results available upon request.
← 8. These results are robust to analysing the risk of generalised anxiety disorder and the risk of major depressive disorder separately.
← 9. Results available upon request.