
Marriage and divorce
Both marriage and divorce rates have increased in the Asia/Pacific region since 2005 (Figure 2.7 and Figure 2.8). The increase in the crude marriage rate across Asia/Pacific was limited, but it contributed to crude marriage rates in the region being almost 1.5 times higher than the average across OECD countries. Crude marriage rates are highest at over nine marriages per 1 000 adults in Fiji, Tajikistan and Uzbekistan; they are around four marriages per 1 000 adults in Australia, Korea, New Zealand and Thailand.
Since 2005, crude divorce rates have increased in most Asia/Pacific countries – and by around 25% across the region on average, while crude divorce rates in China more than doubled. In contrast, crude divorce rates fell among the OECD countries in the Asia/Pacific region – Australia, Japan, Korea and New Zealand.
Across the Asia/Pacific the mean age of first marriage has increased by 3 years on average since 2005 (Figure 2.9). In 2005, the mean age at first marriage across the selected Asia/Pacific economies was 24.0 years for women and 27.4 years for men. By 2019, the mean age at first marriage had increased to 27.5 years for women and to 30.1 years for men, still some 3 to 3.5 years below the OECD average for men and women. A strong tendency of postponing marriages is observed across Asia/Pacific economies, but large cross-national differences remain: since 2005, the mean age at first marriage has increased by about four years among men and women in Armenia, while change was much more limited in New Zealand and Singapore where the mean age of first marriage for men increased by less than a year. Only in Viet Nam, is the mean age for women in 2019 slightly lower than in 2005.
The crude marriage rate is defined as the number of legal civil unions or marriages formed each year per 1 000 adults. The crude divorce rate (CDR), defined as the number of legal civil unions or marriages that are dissolved each year per 1 000 adults.
The mean age at first marriage is defined as the mean average age in years of marrying persons at the time of first marriage. This measure is disaggregated by gender with separate averages for men and women.
The data were taken from the 2019 UN Demographic Yearbook of the UN department of Economic and Social Affairs Statistics Division (2019[1]), OECD Family Database Asia Pacific (2021[2]), Australian Bureau of Statistics (2020[3]), Statistics New Zealand (2020[4]), Statistics Bureau Japan (2021[5]), and Korea’s official statistics (2020[6]).
References
[3] Australian Bureau of Statistics (2020), Marriages and Divorces, Australia, https://www.abs.gov.au/statistics/people/people-and-communities/marriages-and-divorces-australia/latest-release.
[6] KOSIS (2020), KOrean Statistical Information Service, https://kosis.kr/search/search.do.
[2] OECD (2021), OECD Family Database Asia/Pacific, http://www.oecdkorea.org/user/nd8662.do.
[5] Statistics Bureau Japan (2021), Statistical Handbook of Japan 2021, https://www.stat.go.jp/english/data/handbook/pdf/2021all.pdf#page=23.
[4] Stats NZ Tatauranga Aotearoa (2020), Marriages, civil unions, and divorces: Year ended December 2020, https://www.stats.govt.nz/information-releases/marriages-civil-unions-and-divorces-year-ended-december-2020.
[1] UN Demographic Yearbook (2019), Demographic and Social Statistics, https://unstats.un.org/unsd/demographic-social/products/dyb/dyb_2019/.
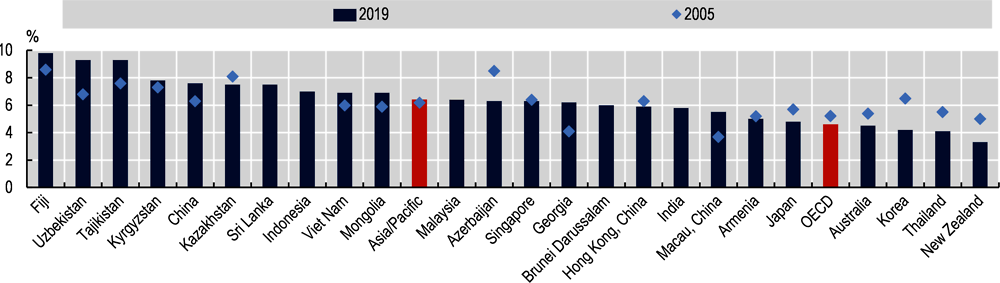
Note : Data refer to 2019 except for Korea, Mongolia, New Zealand and Thailand (2020), Armenia, Azerbaijan, Brunei Darussalam, Georgia, India, Kyrgyzstan, Malaysia, and Tajikistan (2018), Indonesia (2016) and Fiji (2014). The OECD average is the unweighted average across the 34 OECD countries with data available.
Source: United Nations (2019), UN Demographic Yearbook 2019; OECD (2021), OECD Family Database Asia Pacific (China, Indonesia, Mongolia, Thailand and Viet Nam); Australian Bureau of Statistics (2020), Marriages and Divorces; Stats NZ Tatauranga Aotearoa (2020), Marriages, civil unions, and divorces, December 2020; Statistics Bureau Japan (2021), Statistical Handbook of Japan 2021; KOSIS Korean Statistical Information Service (2020), Crude Divorce Rate 2020.
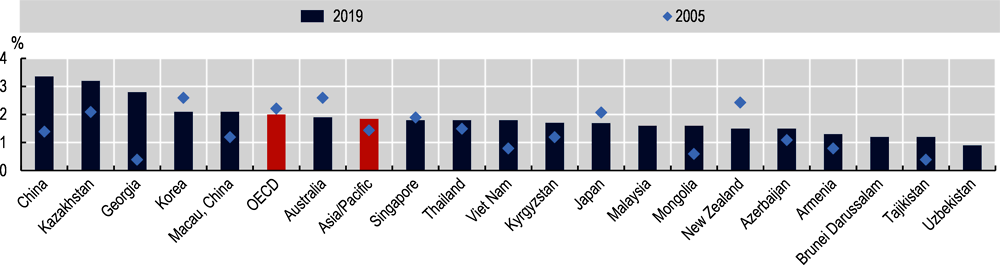
Note: Data refer to 2019 except for Korea, Mongolia and Thailand (2020) and Armenia, Azerbaijan, Brunei Darussalam, Georgia, Kyrgyzstan, Malaysia, and Tajikistan (2018). The OECD average is the unweighted average across the 36 OECD countries with data available.
Source: United Nations (2019), UN Demographic Yearbook 2019; OECD (2021), OECD Family Database Asia Pacific (China, Mongolia, Thailand and Viet Nam); Australian Bureau of Statistics (2020), Marriages and Divorces; Stats NZ Tatauranga Aotearoa (2020), Marriages, civil unions, and divorces, December 2020; Statistics Bureau Japan (2021), Statistical Handbook of Japan 2021; KOSIS Korean Statistical Information Service (2020), Crude Divorce Rate 2020; other countries, OECD (2021), OECD Family Database.
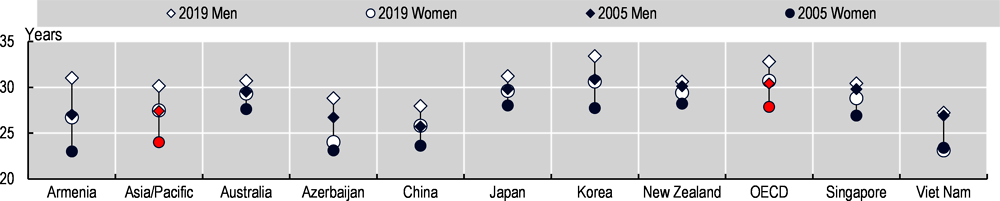
Note: Data for Armenia and Singapore refer to 2018 and 2020 respectively.
Source: Eurostat (2021), (Armenia and Azerbaijan); OECD (2021), OECD Family Database Asia Pacific (China, Korea, Mongolia, and Viet Nam); Australian Bureau of Statistics (2020), Marriages and Divorces; Statistics Singapore (2020), Statistics on Marriages and Divorces, 2020 (Singapore); Stats NZ Tatauranga Aotearoa (2020), Marriages, civil unions, and divorces, December 2020; Statistics Bureau Japan (2021), Statistical Handbook of Japan 2021; KOSIS Korean Statistical Information Service (2020), Crude Divorce Rate 2020; other countries, OECD (2021), OECD Family Database.