copy the linklink copied!Indicator B6. What is the profile of internationally mobile students?
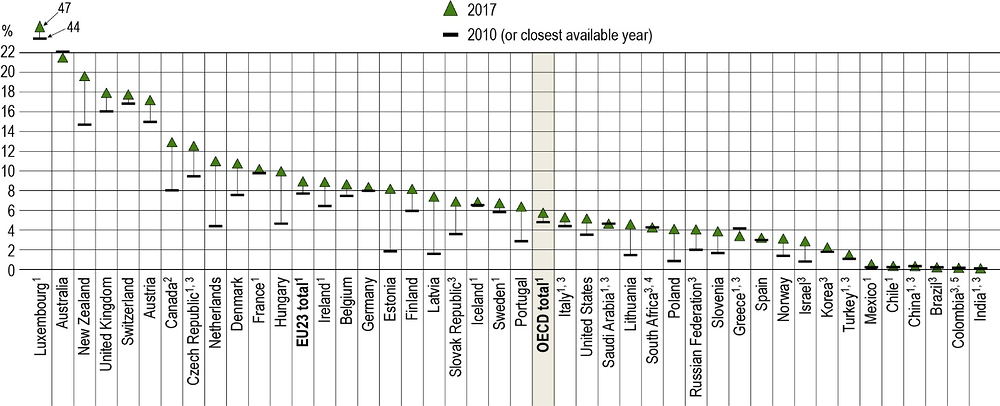
Overall, the share of internationally mobile students across the OECD increased by 2 percentage points between 2010 and 2017. Over this time period, the share of incoming students increased in nearly all the countries with data available and particularly in Estonia, Hungary, Latvia, the Netherlands and New Zealand.
English-speaking countries are the most attractive to international students. Australia, Canada, the United Kingdom and the United States together receive more than 40% of all mobile students in OECD and partner countries. Other main destination areas include France, Germany and the Russian Federation.
Students from Asia form the largest group of international students enrolled in tertiary education programmes at all levels, representing 56% of all mobile students across the OECD in 2017. Two-thirds of Asian students converge on only five countries: Australia, Canada, Japan, the United Kingdom and the United States. European students prefer to stay in the European Union (EU); they account for 24% of mobile students in all OECD destination countries but 42% in the OECD countries within the EU.
1. Years of reference 2013 and 2017.
2. Years of reference 2012 and 2017.
3. Share of foreign rather than international students.
4. Years of reference 2013 and 2016.
5. Years of reference 2014 and 2017.
Countries are ranked in descending order of the percentage of international or foreign students in 2017.
Source: OECD/UIS/Eurostat (2019). See Source section for more information and Annex 3 for notes (https://doi.org/10.1787/f8d7880d-en).
Context
Studying abroad has become a key differentiating experience for young adults enrolled in tertiary education, and international student mobility has received increasing policy attention in recent years. Studying abroad is an opportunity to access high-quality education, acquire skills that may not be taught at home and get closer to labour markets that offer higher returns on education. Studying abroad is also seen as a way to improve employability in increasingly globalised labour markets. Other motivations include the desire to expand knowledge of other societies and to improve language skills, particularly English.
For host countries, mobile students may be an important source of income and have a disproportionate impact on economic and innovation systems. International students often pay higher tuition fees than domestic students (see Indicator C5) and, in some countries, incur higher registration fees. They also contribute to the local economy through their living expenses. In the longer run, highly educated mobile students are likely to integrate into domestic labour markets, contributing to innovation and economic performance.
Attracting mobile students, especially if they stay permanently, is therefore a way to tap into a global pool of talent, compensate for weaker capacity at lower educational levels, support the development of innovation and production systems and, in many countries, to mitigate the impact of an ageing population on future skills supply (OECD, 2016[1]). There is, however, a risk of squeezing out qualified national students from domestic tertiary educational institutions that differentiate tuition fees by student origin, as they may tend to give preference to international students who generate higher revenues through higher tuition fees.
For their countries of origin, mobile students might be viewed as lost talent (or “brain drain”). However, mobile students can contribute to knowledge absorption, technology upgrading and capacity building in their home country, provided they return home after their studies or maintain strong links with nationals at home. Mobile students gain tacit knowledge that is often shared through direct personal interactions and can enable their home country to integrate into global knowledge networks. Some research suggests that students overseas are a good predictor of future scientist flows in the opposite direction, providing evidence of a significant movement of skilled labour across nations, which can also be referred to as “brain circulation” effect (Appelt et al., 2015[2]). In addition, student mobility appears to shape international scientific co-operation networks more deeply than either a common language or geographical or scientific proximity.
Competition for talent has become more intense and global, prompting educational institutions to access a wider pool of high-potential students, with a view to increasing their reputation and revenues (Hénard, Diamond and Roseveare, 2012[3]). The popularity of university league tables and other institutional rankings has reinforced a perception of quality differences across institutions (Perkins and Neumayer, 2014[4]). As part of their internationalisation strategy, more institutions are creating offshore satellite campuses or double degrees, changing admission rules for foreign students, revising curricula to encourage teaching in foreign languages, or offering online courses and international internships. As a consequence, the international activities of educational institutions have not only expanded in volume and scope, but also in complexity.
Other findings
The number of foreign students engaged in tertiary education programmes worldwide has expanded massively in past few decades, rising from 2 million in 1998 to 5.3 million in 2017. In the OECD area, there were 3.7 million international or foreign students in 2017, 6% more than in 2016.
Students become more mobile as they reach more advanced levels of education. International students account for only 3% of total enrolment in short-cycle tertiary programmes and 4% of total enrolment in bachelor's programmes, but they represent 22% of enrolment in doctoral programmes.
Analysis
Trends in the number of international students
Student migration into the OECD area remains dynamic, but international student mobility is also consolidating in developing economies (Box B6.1). Mobile students refer to both international students (those who cross borders for the sole purpose of study) and foreign students (students who do not hold the same nationality as the host country), whose number is used in some countries as a proxy measure for the number of international (cross-border) students (see Definitions section).
The relative concentration of international and foreign students in different levels of tertiary education gives a fair indication of the attractiveness of educational programmes across countries. Incoming student mobility in tertiary education in a country is determined by the number of mobile students as a share of the overall number of students in tertiary education. The level of incoming mobility is 6% on average across OECD countries but in about one-third of the OECD countries, it equals or exceeds 10%. Incoming international students made up at least 15% of tertiary students in Australia, Austria, Luxembourg, New Zealand, Switzerland and the United Kingdom, peaking at 47% for Luxembourg and 21% for Australia. The Czech Republic (13%) and the Slovak Republic (7%) have the largest shares of foreign students at tertiary level.
Overall, the total share of mobile students across the OECD increased by 0.4 percentage points between 2010 and 2013 and another 1.6 percentage points over the period 2013-17, but the growth in international student mobility varies significantly across countries. Between 2010 and 2017, the share of incoming mobile students increased in nearly all countries with data available. In Australia, the share fell slightly, by 1 percentage point, while still remaining high. More than half of these countries observed an increase of at least 3 percentage points over the same period (Figure B6.1), especially the Netherlands (7 percentage points), Estonia, Latvia (both with a 6-percentage-point increase), Hungary and New Zealand (both with 5 percentage points). Among the countries for which data were only available for a shorter time period, the share of international students increased the most in the Czech Republic, Ireland and Luxembourg, by more than 2 percentage points over the period 2013-17.
Looking at longer-term trends, the number of mobile students enrolled in tertiary education programmes worldwide has expanded massively over the last two decades. It rose from 2 million in 1998 to 5.3 million in 2017, growing at an average annual rate of 5% among OECD countries and 6% among non-OECD countries. This increase was constant with peaks in 2002-03 and 2014-16 and a slight levelling off in long-term trends in 1999, 2004 and 2012 (Figure B6.2). However, the number of international students began increasing strongly again in 2014 (an increase of 7% over 2013) and the years that followed, with annual increases of 8% in both 2015 and 2016. In the last year with available data, the growth was slightly more moderate, returning to 5% between 2016 and 2017.
The increase in foreign enrolment is being driven by a variety of domestic and external factors, both push (encouraging outward mobility) and pull (encouraging inward mobility) (UNESCO, 2013[5]). The skills needs of increasingly knowledge-based and innovation-driven economies have spurred demand for tertiary education worldwide, while local education capacities have not always evolved fast enough to meet growing domestic demand. Rising wealth in emerging economies has further prompted children of the growing middle classes to seek educational opportunities abroad. At the same time, economic factors (e.g. costs of international flights), technological factors (e.g. the spread of the Internet and social media to maintain contacts across borders) and cultural factors (e.g. use of English as a common working and teaching language) have contributed to making international mobility substantially more affordable and less irreversible than in the past.
Most countries have implemented reforms aiming to lower the barriers to migration of highly skilled individuals, beyond education purposes, and most countries operate funding programmes to support inward, outward or return mobility. While the conditions of migration differ (e.g. short-term vs. long-term settlement), the most common target populations of these programmes are pre-doctoral students and early stage researchers (both doctoral and postdoctoral).
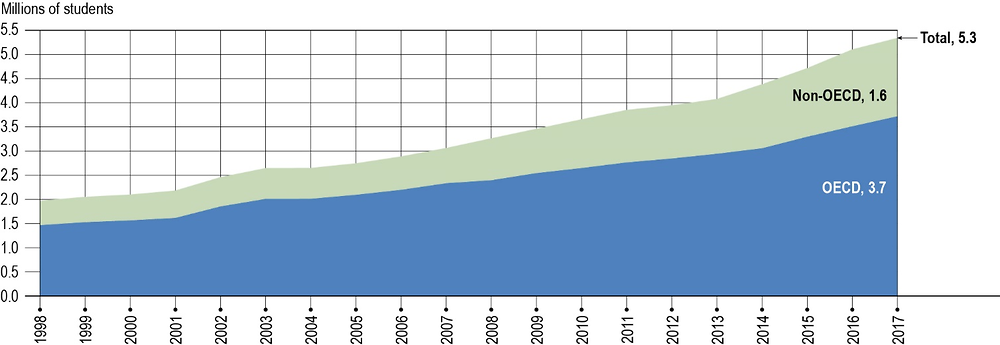
Note: The data sources use similar definitions, thus making their combination possible. Missing data were imputed with the closest data reports to ensure that breaks in data coverage do not result in breaks in time series.
Source: OECD/UIS/Eurostat (2019). Other non-OECD countries and years prior to 2013: UNESCO Institute for Statistics. See Source section for more information and Annex 3 for notes (https://doi.org/10.1787/f8d7880d-en).
Profiles of internationally mobile students
Students are more likely to travel abroad for more advanced education programmes. In all but a few countries, the share of international students enrolled in tertiary programmes increases gradually with education level. On average across OECD countries, international students account for 6% of total enrolment in tertiary programmes, but 22% of all enrolments at doctoral level.
International enrolment in bachelor’s programmes remains relatively low (below 5% in nearly half of the countries for which data are available). However, a few countries have a more international profile at this level. In Austria, Luxembourg and New Zealand, more than 15% of students at bachelor’s level are international (Figure B6.3).
The share of tertiary-educated young adults (aged 25-34) has been increasing in OECD-G20 countries over the past decade, and it is expected to keep growing in the next 15 years. Countries that were lagging behind should experience the fastest increases and catch up, while countries with initially larger shares of tertiary-educated adults should face slower growth. If trends remain constant, the People’s Republic of China and India could account for a particularly large share of the OECD-G20 pool of tertiary-educated young adults, despite the projected drop in China’s young adult population.
As Figure B6.a shows, it is possible to project regional contributions to OECD-G20 pool of tertiary-educated young adults in 2030 based on the expected educational attainment and population changes. China and India, which together accounted for 40% of tertiary-educated young adults in 2015, should keep their overall rank. While China’s contribution is likely to fall by 4 percentage points in the next decade, mainly due to its decreasing population, India’s will significantly increase. Latin American countries, in which 20% of young adults in 2015 had attained tertiary education, are likely to experience a particularly fast increase (more than 2.5% growth per year). In contrast, the North American countries and the Russian Federation are expected to witness the slowest increases.
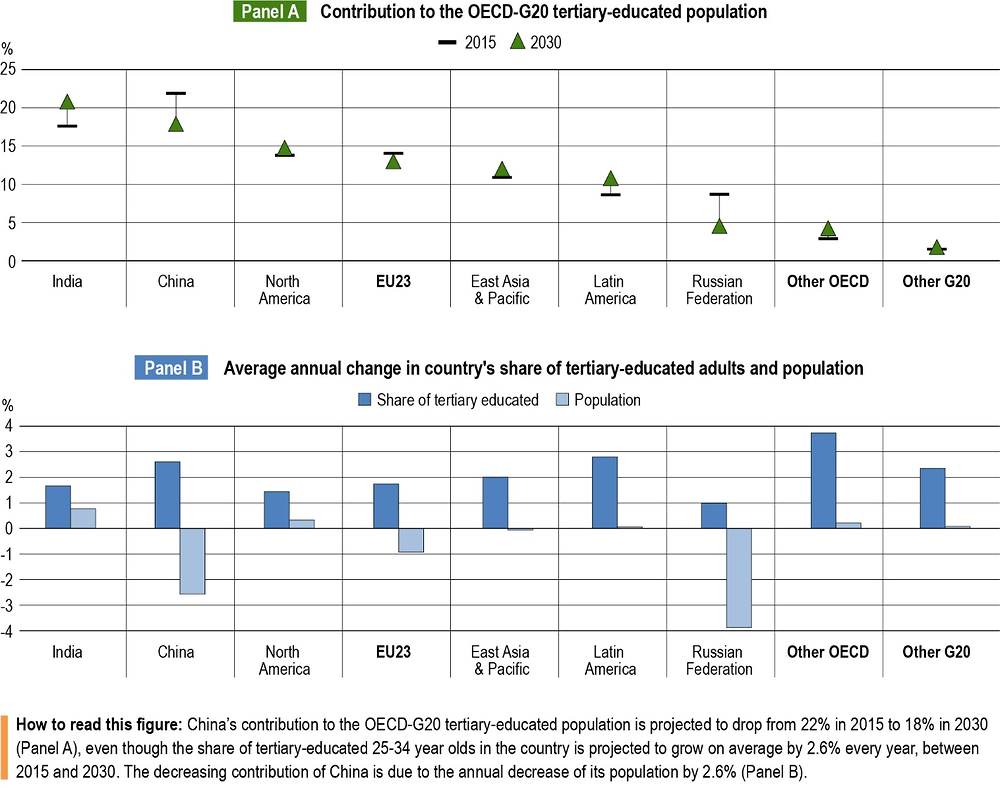
Countries and regions are ranked in descending order of their projected regions contribution to the OECD-G20 tertiary-educated population of 25-34 year-olds in 2030.
Source: OECD (2018[6]), "How is the tertiary-educated population evolving?", Education Indicators in Focus, No. 61 (https://doi.org/10.1787/a17e95dc-en).
International enrolment increases significantly at master’s level. On average across the OECD, 13% of students are international or foreign at this level. The proportion of incoming students at least doubles between bachelor’s and master’s levels in nearly two-thirds of OECD countries. The share of international students in Chile, Spain and Sweden is at least four times higher at master’s than at bachelor’s level. Greece, on the other hand, seems relatively less attractive to master’s students, as its inflows of foreign students are slightly lower than at bachelor’s level (Figure B6.3).
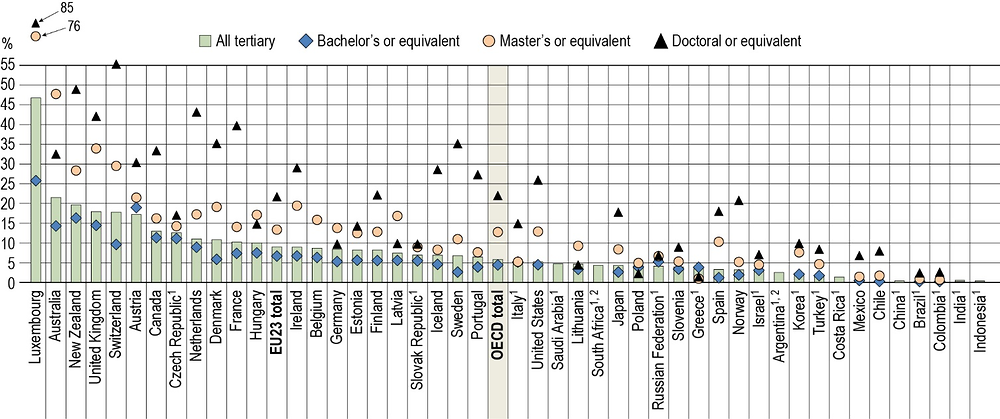
Note: All tertiary education includes short-cycle tertiary programmes, which are not presented separately in the figure.
1. Share of foreign rather than international students.
2. Year of reference 2016.
Countries are ranked in descending order of the percentage of international or foreign students in tertiary education.
Source: OECD (2019), Table B6.1. See Source section for more information and Annex 3 for notes (https://doi.org/10.1787/f8d7880d-en).
International enrolment is much higher at doctoral level in the OECD area, particularly in France, Luxembourg, the Netherlands New Zealand, Switzerland and the United Kingdom, where 40% or more tertiary students come from abroad. In Luxembourg and Switzerland, there are more international students in doctoral programmes than national students (85% of enrolments in Luxembourg and 55% of enrolments in Switzerland come from overseas at this level). While most countries have higher shares of international students at doctoral than at master’s level, a number of countries show the opposite pattern. This is particularly striking in Australia (decreasing from 48% at master’s level to 32% at doctoral level), Germany (from 14% to 10%), Hungary (from 17% to 15%), Latvia (from 17 to 10%), Lithuania (from 9% to 4%) and Poland (from 5% to 2%) (Figure B6.3).
International student flows in tertiary education
In 2017, there were 3.7 million international students enrolled in tertiary education programmes across OECD countries. The pools and flows of this mobile talent remain very concentrated worldwide, and mobility pathways are deeply rooted in historical patterns.
Identifying the determinants of international student mobility is key to designing efficient policies to encourage the movement of skilled labour. Student migration is mainly driven by differentials in education capacity (i.e. a lack of educational facilities in the country of origin or the prestige of educational institutions in the country of destination). It is also driven by differentials between origin and destination countries in the returns to or rewards for education and skills. Economic factors include better economic performance by the host country, exchange rates, more affordable mobility (due to lower tuition fees or higher education subsidies, for instance) and higher-quality education in the host country. In addition, the decision to study abroad may be determined by non-economic factors, such as political stability or cultural and religious proximity between origin and destination countries (Guha, 1977[7]; UNESCO, 2013[8]; Weisser, 2016[9]).
Setting appropriate tuition fees remains one of the most debated topics in education policy, in a context where policy makers aim to increase participation in higher education and achieve greater equity in education. The cost of education for individuals varies substantially across countries. These result from different funding models across tertiary institutions, combined with different levels of public financial support allocated to tertiary students (see Indicator C5).
The perceived quality of instruction abroad and the perceived value of host institutions are key criteria for international students when selecting their country of destination (Abbott and Silles, 2016[10]). Top destinations for internationally mobile students include a large number of top-ranked higher education institutions. Students worldwide are increasingly aware of differences in quality among tertiary education systems, as university league tables and other international university rankings are widely disseminated. At the same time, the ability to attract international students has become a criterion in assessing the performance and quality of institutions. As governments seek to encourage the internationalisation of higher education, they have revised performance agreements with domestic institutions, for example by taking into account the inflows of international students in university funding formulas.
Main destination countries of mobile students studying in OECD countries
English is the lingua franca of the globalised world, with one in four people using it worldwide (Sharifian, 2013[11]). Not surprisingly, English-speaking countries are the most attractive student destinations overall, with four countries receiving more than 40% of all mobile students in OECD and partner countries. The United States is the top OECD destination country for mobile tertiary students. Of the 3.7 million international students in the OECD area, 985 000 enrol in programmes in the United States. Among English-speaking countries, after the United States, the United Kingdom accounts for 436 000 international students, Australia 381 000 and Canada 210 000 (Figure B6.4). As a destination country, the United States alone accounts for 22% of the total international education market share in OECD and partner countries (about 18% of the number of mobile students globally). Australia and the United Kingdom each have between 9% and 10% of the market share for OECD and partner countries, while Canada has 5%. The United States has an even higher share at doctoral level, hosting 26% of the internationally mobile doctoral students in OECD and partner countries.
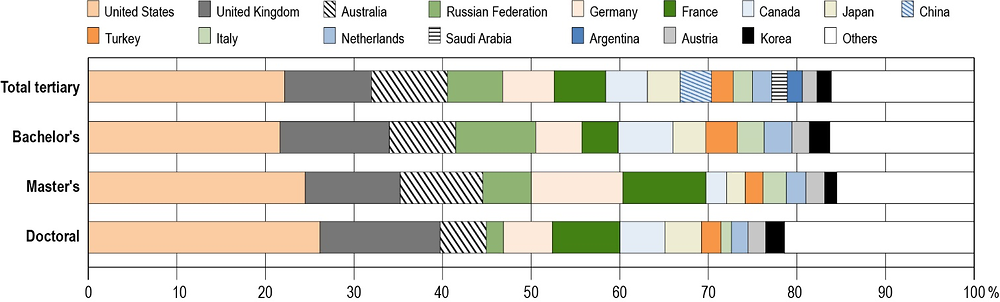
Note: All tertiary education includes short-cycle tertiary programmes, which are not presented separately in the figure. Year of reference 2016 for Argentina and South Africa.
Countries are ranked in descending order of the incoming international or foreign students as a share of all mobile students in OECD and partner countries.
Source: OECD (2019), Table B6.3. See Source section for more information and Annex 3 for notes (https://doi.org/10.1787/f8d7880d-en).
Initiatives at national, regional, local, supranational or institutional level have also contributed to cross-border mobility. In 2011, the European Union (EU) set the ambitious goal of increasing the proportion of EU graduates from higher education who completed a period of their studies or training abroad to 20% by 2020 (Council of the European Union, 2011[12]).
Table B6.a. Credit mobility in European OECD member countries (2017) |
|---|
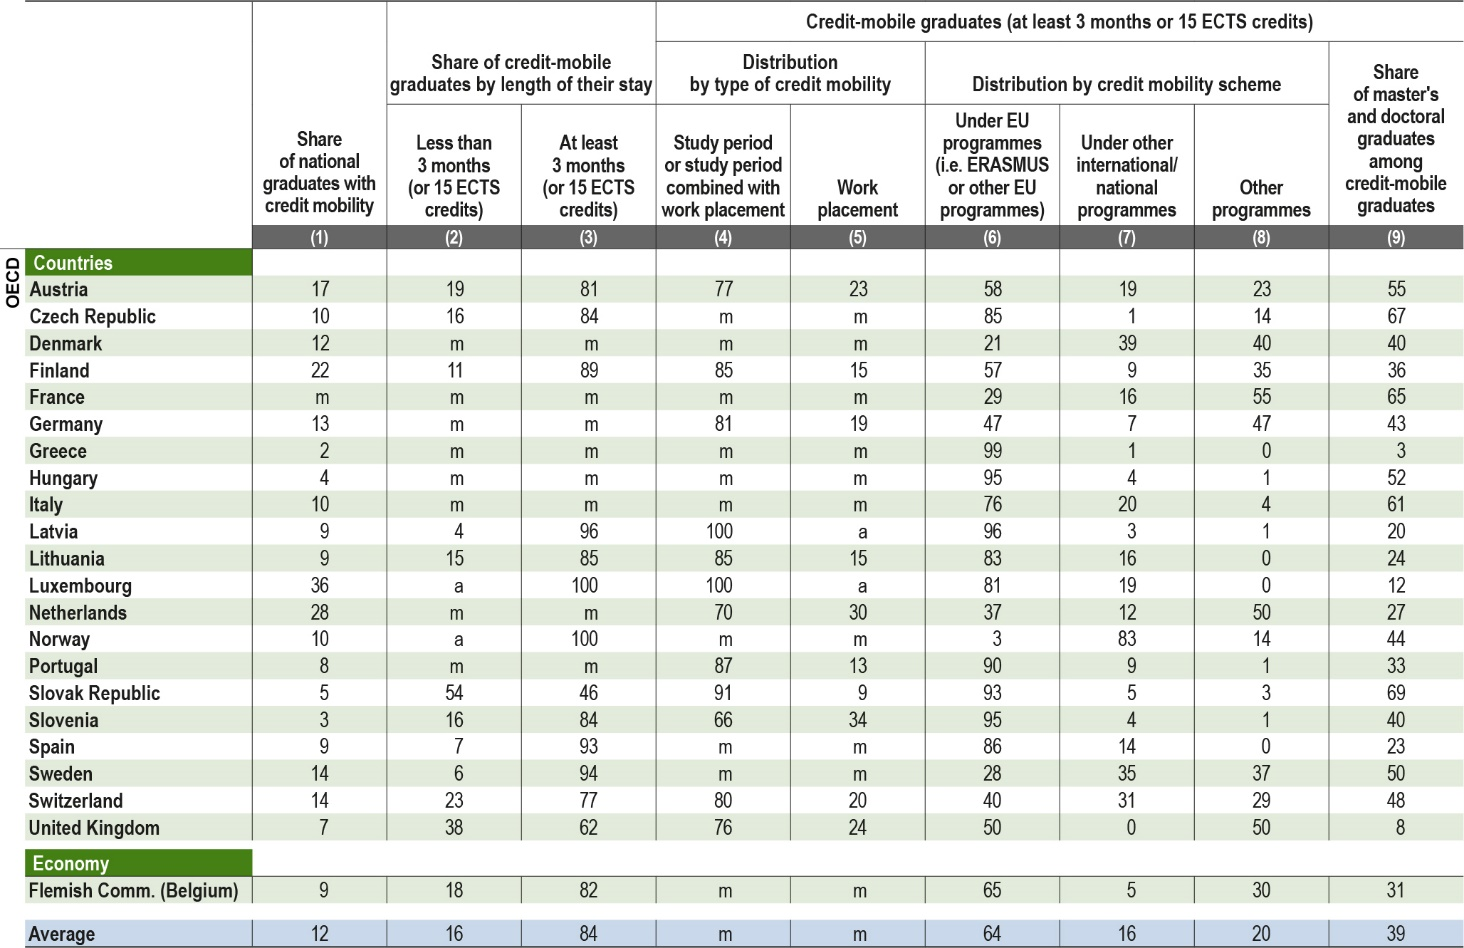 |
Note: The ECTS (European Credit Transfer and Accumulation System) credits are based on the workload students need in order to achieve expected learning outcomes. Sixty credits are the equivalent of a full year of study or work. In a standard academic year, 60 credits would be usually broken down into several smaller components. |
Source: OECD/UIS/Eurostat (2019). See Source section for more information and Annex 3 for notes (https://doi.org/10.1787/f8d7880d-en). |
The EU had already started to make European higher education more homogeneous and comparable across countries and more attractive to international students in 1999 with the Bologna process, which set in motion a series of reforms. Its main objectives were the introduction and standardisation of a three-cycle degree system (bachelor’s, master’s and doctoral degrees), and the recognition of qualifications from foreign institutions and of periods of study. One of the underlying objectives of the process was to stimulate mobility across Europe of students, teachers and researchers.
The Erasmus+ programme (and its predecessor Erasmus) gives students and teaching staff the opportunity to develop their skills and boost their employment prospects. Students can study abroad for up to 12 months (during each cycle of tertiary education). Over the period 2014-20, around 2 million students are expected to have benefited from Erasmus+ (EUROSTAT, 2018[13]).
Students who are temporarily studying abroad to gain academic credit within the framework of a tertiary education programme at their home institutions are defined as credit mobile students (UNESCO-UIS / OECD / EUROSTAT, 2018[14]). Credit mobility is distinct from degree mobility as degree mobile students – the subject of the rest of this indicator – are enrolled as regular students with the objective of graduating in the country of destination. On average across the European countries that are members of the OECD, 12% of 2017 graduates had benefited from credit mobility, ranging from less than 5% in Greece and Slovenia to 36% in Luxembourg. With the exception of the Slovak Republic, graduates from most countries spent at least three months abroad (84% of all credit-mobile graduates on average) or a similar period in terms of study or workload (Table B6.a). Of these, 38% had studied at master’s or doctoral levels.
Erasmus+ and other EU programmes account for the great majority (64%) of credit-mobile graduates who studied abroad at least three months, ranging from 3% in Norway (which is not a member of the EU) and 21% in Denmark to 95% or more in Greece, Hungary, Latvia and Slovenia. In addition, students may benefit from credit mobility through other international or national programmes, including other bi- or multilateral programmes such as partnerships between universities, or other programmes involving students organising their own mobility, which is then credited by their home institution. The Nordic and Baltic countries, for example, operate the Nordplus Higher Education Programme, a broad mobility and network programme that aims to reinforce collaboration, joint curriculum planning, student and teacher mobility and the sharing of best practices between institutions.
Credit mobility mostly involves participation in academic study, but it can also take other forms, such as work placements, internships or traineeships. In all the countries with available data, most graduates who had travelled abroad for at least three months did so to benefit from a study period abroad (with or without a work placement), but in 10 countries students are also allowed to benefit from credit mobility for a standalone work placement without a study component.
The European Union is another key geographical area for inward mobility, with 1.7 million mobile students enrolled in the 23 OECD countries that are also members of the EU (EU23). After the United Kingdom, France and Germany (both with nearly 260 000 students) are major host countries for international students, far ahead of Italy (98 000), the Netherlands (96 000) and Austria (74 000). As destination countries, France and Germany each account for 6% of the international students in OECD and partner countries (about 5% of the global share). Their shares increase at master’s level where they hosted between 9% and 10% of mobile master’s students in OECD and partner countries in 2017 (Table B6.3). The Russian Federation is also a major destination country, with 278 000 students enrolled from abroad, accounting for 6% of mobile students in OECD and partner countries in all tertiary programmes and 9% at bachelor’s level.
Japan is the preferred Asian destination among OECD and partner countries, with 164 000 international students, just above China with 157 000 foreign students: they each have a share of 4% in the international education market in OECD and partner countries and about 3% globally. Finally, Argentina is the most popular destination for mobile students among Latin American countries with a 2% share of the number of mobile students in OECD and partner countries (Figure B6.4).
Regions of origin
Data on international student flows illustrate the strength of proximity factors, such as language, historical ties, geographical distance, bilateral relationships and political framework conditions (e.g. the European Higher Education Area) as key determinants for mobility.
Students from Asia form the largest group of international students enrolled in tertiary education programmes at all levels, totalling 2.1 million and 56% of all mobile students across the OECD in 2017 (Figure B6.5). Of these, over 860 000 come from China. Two-thirds of Asian students converge on only five countries: Australia, Canada, Japan, the United Kingdom and the United States.
The second major region of origin of international students is Europe, who make up 24% of all mobile students enrolled in OECD countries. European students prefer to stay in Europe, as their share reaches 42% of mobile students enrolled in the EU23 countries (Box B6.2). At least 8 out of 10 mobile students in Austria, Denmark, Luxembourg, Poland, Portugal, the Slovak Republic and Slovenia come from European countries. Students from Luxembourg are the most mobile in tertiary education as 3 out of 4 enrol in a tertiary programme abroad (this leads to the underestimation of tertiary enrolment rates in Luxembourg, see Indicator B1). Students from Iceland and the Slovak Republic are also more likely to study abroad than nationals from other OECD and partner countries: 14%-18% of their national students are enrolled in a tertiary programme abroad (Table B6.3). Demonstrating the importance of proximity, in Austria, the Czech Republic, Luxembourg, the Slovak Republic and Switzerland more than 50% of international or mobile students in 2017 came from neighbouring countries.
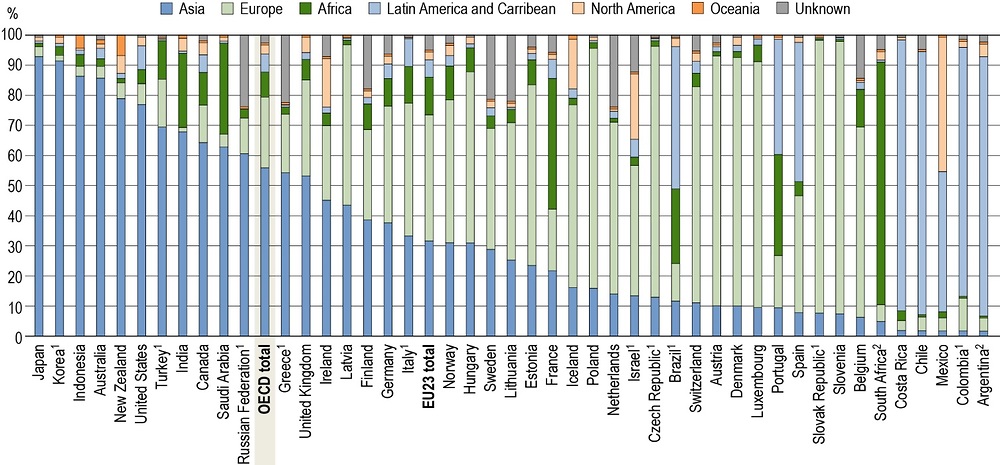
1. Share of foreign rather than international students.
2. Year of reference 2016.
Countries are ranked in descending order of the percentage of international or foreign students from Asia.
Source: OECD (2019), Table B6.2. See Source section for more information and Annex 3 for notes (https://doi.org/10.1787/f8d7880d-en).
Students from African countries make up the majority of foreign students only in South Africa (81% of students are mobile) among OECD and partner countries, although at least 3 out of 10 mobile students are from Africa in France, Portugal and Saudi Arabia. International student flows from Latin America and the Caribbean highlight proximity patterns, as they represent the majority of mobile students in Argentina, Brazil, Chile, Colombia, Costa Rica and Mexico, but also the importance of the language of studies: between 4 and 5 in every 10 mobile students in Portugal and Spain come from this region. Finally, North American students represent more than 10% of international enrolment only in Iceland, Ireland, Israel and Mexico, while students from Oceania are a minority of international students in all OECD and partner countries, making up only 1% of mobile students in OECD destination countries (Figure B6.5).
Definitions
There are two types of mobility: degree mobility and credit mobility. Degree-mobile students are enrolled as regular students in any semester/term of a programme taught in the country of destination with the intention of graduating from it in the country of destination (distance learners are not considered as mobile). Credit mobility is defined as temporary tertiary education or study-related traineeships abroad within the framework of enrolment in a tertiary education programme at a home institution, usually for the purpose of gaining academic credit. Credit-mobile students do not obtain their qualifications from the host institution abroad.
Foreign students are those who are not citizens of the country in which they are enrolled and where the data are collected. Although they are counted as internationally mobile, they may be long-term residents or even be born in the “host” country. While pragmatic and operational, this classification may be inappropriate for capturing student mobility because of differing national policies regarding the naturalisation of immigrants. For instance, Australia has a greater propensity than Switzerland to grant permanent residence to its immigrant populations. This implies that even when the proportion of foreign students in tertiary enrolment is similar for both countries, the proportion of international students in tertiary education will be smaller in Switzerland than in Australia. Therefore, for student mobility and bilateral comparisons, interpretations of data based on the concept of foreign students should be made with caution. In general, international students are a subset of foreign students.
International students are those who left their country of origin and moved to another country for the purpose of study. The country of origin of a tertiary student is defined according to the criterion of “country of upper secondary education”, “country of prior education” or “country of usual residence” (see below). Depending on country-specific immigration legislation, mobility arrangements (such as the free mobility of individuals within the European Union and the European Economic Area) and data availability, international students may be defined as students who are not permanent or usual residents of their country of study, or alternatively as students who obtained their prior education in a different country.
The country of prior education is the country in which students obtained their upper secondary qualification (upper secondary or post-secondary non-tertiary completion with access to tertiary education programmes) or the qualification required to enrol in their current level of education. Where countries are unable to operationalise this definition, it is recommended that they use the country of usual or permanent residence to determine the country of origin. Where this too is not possible and no other suitable measure exists, the country of citizenship may be used.
Permanent or usual residence in the reporting country is defined according to national legislation. In practice, this means holding a student visa or permit, or electing a foreign country of domicile in the year prior to entering the education system of the country reporting the data.
Country-specific operational definitions of international students are indicated in the tables as well as in Annex 3 (https://doi.org/10.1787/f8d7880d-en).
Methodology
Defining and identifying mobile students, as well as their types of learning mobility, are a key challenge for developing international education statistics, since current international and national statistical systems only report domestic educational activities undertaken within national boundaries (OECD, 2018[15]).
Data on international and foreign students are therefore obtained from enrolments in their countries of destination. This is the same method used for collecting data on total enrolments, i.e. records of regularly enrolled students in an education programme. Students enrolled in countries that did not report to the OECD or to the UNESCO Institute for Statistics are not included and, for their countries of origin, the total number of national students enrolled abroad may be underestimated.
The total number of students enrolled abroad refers to the count of international students, unless data are not available and the count of foreign students is used instead. Enrolment numbers are computed using a snapshot method, i.e. counting enrolled students at a given period of time (e.g. a specific day or period of the year).
This methodology has some limits. OECD international statistics on education tend to overlook the impact of distance and e-learning, especially fast-developing massively online open courses (MOOCs), students who commute from one country to another on a daily basis and short-term exchange programmes that take place within an academic year and are therefore under the radar. Other concerns arise from the classification of students enrolled in foreign campuses and European schools in host countries’ student cohorts.
Current data for international students can only help track student flows involving OECD and partner countries as receiving countries. It is not possible to assess extra-OECD flows and, in particular, the contributions of South-South exchanges to global brain circulation.
For more information, please see the OECD Handbook for Internationally Comparative Education Statistics 2018: Concepts, Standards, Definitions and Classifications (OECD, 2018[15]) and Annex 3 for country-specific notes (https://doi.org/10.1787/f8d7880d-en).
Source
Data refer to the academic year 2016/17 and are based on the UNESCO-UIS/OECD/EUROSTAT data collection on education statistics administered by the OECD in 2018 (for details, see Annex 3 at https://doi.org/10.1787/f8d7880d-en). Data on credit mobility, based on the UNESCO-UIS/OECD/EUROSTAT data collection, were administered by Eurostat in 2018.
The UNESCO Institute of Statistics (UIS) provided data 1) for Argentina, China, India, Indonesia, Saudi Arabia and South Africa; 2) for all countries beyond the OECD and partner countries; and 3) for OECD countries for the period not covered by OECD statistics (2005 and 2010-17).
Note regarding data from Israel
The statistical data for Israel are supplied by and are under the responsibility of the relevant Israeli authorities. The use of such data by the OECD is without prejudice to the status of the Golan Heights, East Jerusalem and Israeli settlements in the West Bank under the terms of international law.
References
[10] Abbott, A. and M. Silles (2016), “Determinants of international student migration”, The World Economy, Vol. 39/5, pp. 621-635, https://doi.org/10.1111/twec.12319.
[2] Appelt, S. et al. (2015), “Which factors influence the international mobility of research scientists?”, OECD Science, Technology and Industry Working Papers, No. 2015/2, OECD Publishing, Paris, https://dx.doi.org/10.1787/5js1tmrr2233-en.
[12] Council of the European Union (2011), “Council conclusions on the modernisation of higher education”, 3128th Education, Youth, Culture and Sport Council Meeting, Brussels, 28 and 29 November 2011, Council of the European Union, Brussels.
[13] EUROSTAT (2018), Learning mobility statistics - Statistics Explained, https://ec.europa.eu/eurostat/statistics-explained/index.php/Learning_mobility_statistics#Credit_mobile_students (accessed on 4 June 2019).
[7] Guha, A. (1977), “Brain-drain issue and indicators on brain-drain”, International Migration, Vol. 15/1, pp. 3-20, https://doi.org/10.1111/j.1468-2435.1977.tb00953.x.
[3] Hénard, F., L. Diamond and D. Roseveare (2012), Approaches to Internationalisation and Their Implications for Strategic Management and Institutional Practice: A Guide for Higher Education Institutions, OECD, http://www.oecd.org/education/imhe/Approaches%20to%20internationalisation%20-%20final%20-%20web.pdf (accessed on 29 April 2018).
[6] OECD (2018), “How is the tertiary-educated population evolving?”, Education Indicators in Focus, No. 61, OECD Publishing, Paris, https://dx.doi.org/10.1787/a17e95dc-en.
[15] OECD (2018), OECD Handbook for Internationally Comparative Education Statistics 2018: Concepts, Standards, Definitions and Classifications, OECD Publishing, Paris, https://doi.org/10.1787/9789264304444-en.
[1] OECD (2016), OECD Science, Technology and Innovation Outlook 2016, OECD Publishing, Paris, https://doi.org/10.1787/sti_in_outlook-2016-en.
[4] Perkins, R. and E. Neumayer (2014), “Geographies of educational mobilities: Exploring the uneven flows of international students”, The Geographical Journal, Vol. 180/3, pp. 246-259, https://doi.org/10.1111/geoj.12045.
[11] Sharifian, F. (2013), “Globalisation and developing metacultural competence in learning English as an International Language”, Multilingual Education, Vol. 3/1, p. 7, https://doi.org/10.1186/2191-5059-3-7.
[8] UNESCO (2013), The International Mobility of Students in Asia and the Pacific, UNESCO, http://unesdoc.unesco.org/images/0022/002262/226219E.pdf (accessed on 3 July 2018).
[5] UNESCO (2013), The International Mobility of Students in Asia and the Pacific, UNESCO, Paris, http://unesdoc.unesco.org/images/0022/002262/226219E.pdf (accessed on 7 May 2018).
[14] UNESCO-UIS / OECD / EUROSTAT (2018), UOE data collection on formal education: Manual on concepts, definitions and classifications, UNESCO-UIS / OECD / EUROSTAT, Montreal, Paris, Brussels, http://uis.unesco.org/sites/default/files/documents/uoe2016manual_11072016_0.pdf (accessed on 23 January 2019).
[9] Weisser, R. (2016), “Internationally mobile students and their post-graduation migratory behaviour: An analysis of determinants of student mobility and retention rates in the EU”, OECD Social, Employment and Migration Working Papers, No. 186, OECD Publishing, Paris, https://doi.org/10.1787/5jlwxbvmb5zt-en.
Table B6.1 International and foreign student mobility in tertiary education (2010, 2013 and 2017)
Table B6.2 Distribution of international or foreign students by field of study and by region of origin (2017)
Table B6.3 Mobility patterns of foreign and international students (2017)
Cut-off date for the data: 19 July 2019. Any updates on data can be found on line at https://doi.org/10.1787/eag-data-en. More breakdowns can also be found at http://stats.oecd.org/, Education at a Glance Database.
StatLink: https://doi.org/10.1787/888933981020
Table B6.1. International and foreign student mobility in tertiary education (2010, 2013 and 2017) |
|---|
International or foreign student enrolment as a percentage of total tertiary enrolment |
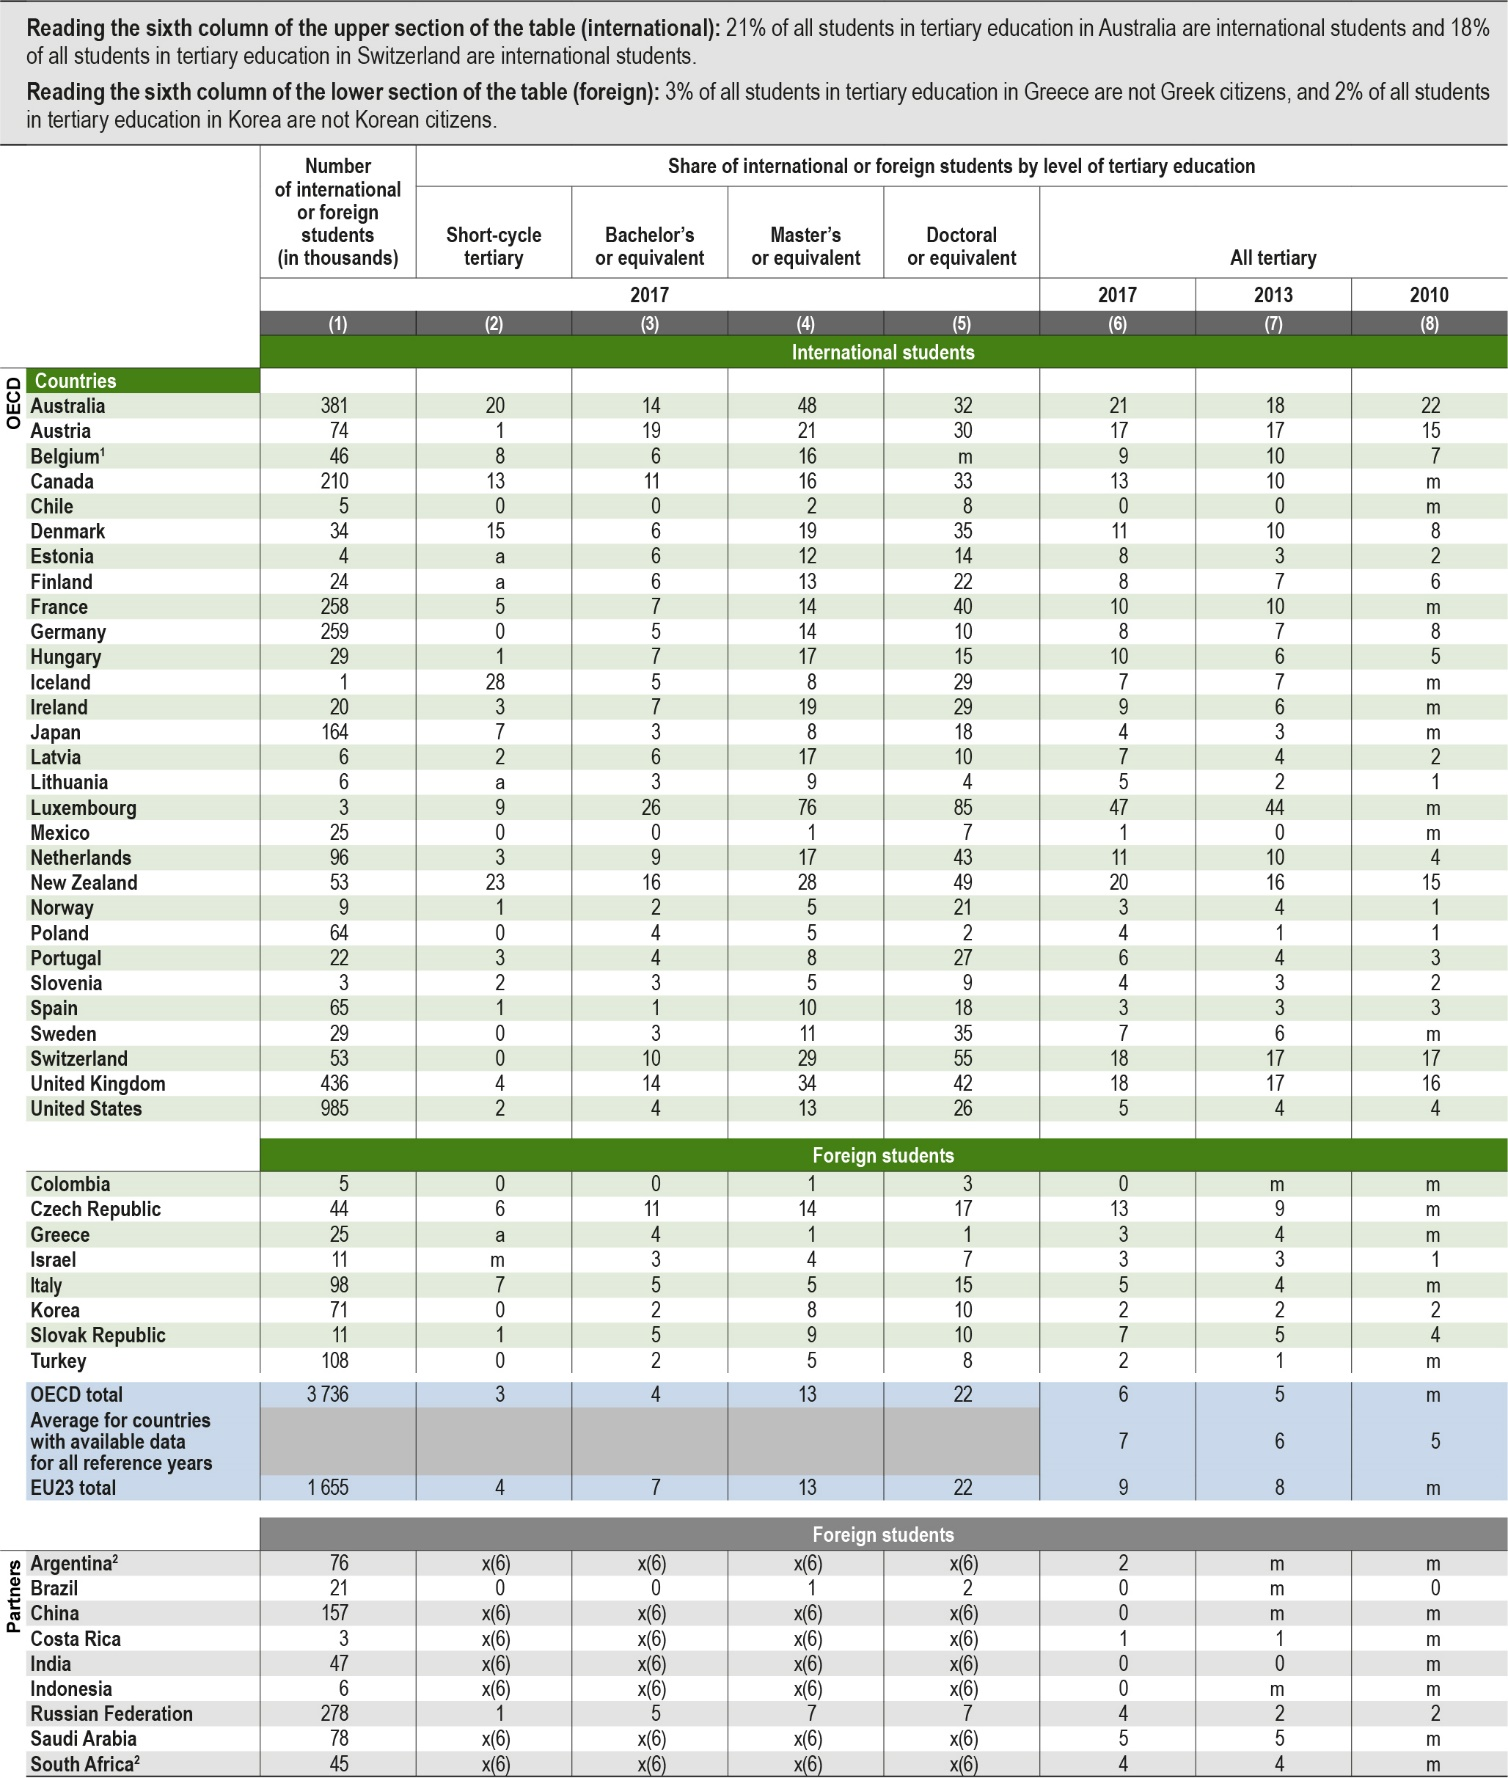 |
1. Data on short-cycle tertiary programmes are based on nationality and refer to the Flemish community only. |
2. Year of reference 2016. |
Source: OECD/UIS/Eurostat (2019). See Source section for more information and Annex 3 for notes (https://doi.org/10.1787/eag-2019-36-en). |
Please refer to the Reader's Guide for information concerning symbols for missing data and abbreviations. |
Table B6.2. Distribution of international or foreign students by field of study and by region of origin (2017) |
|---|
All tertiary programmes |
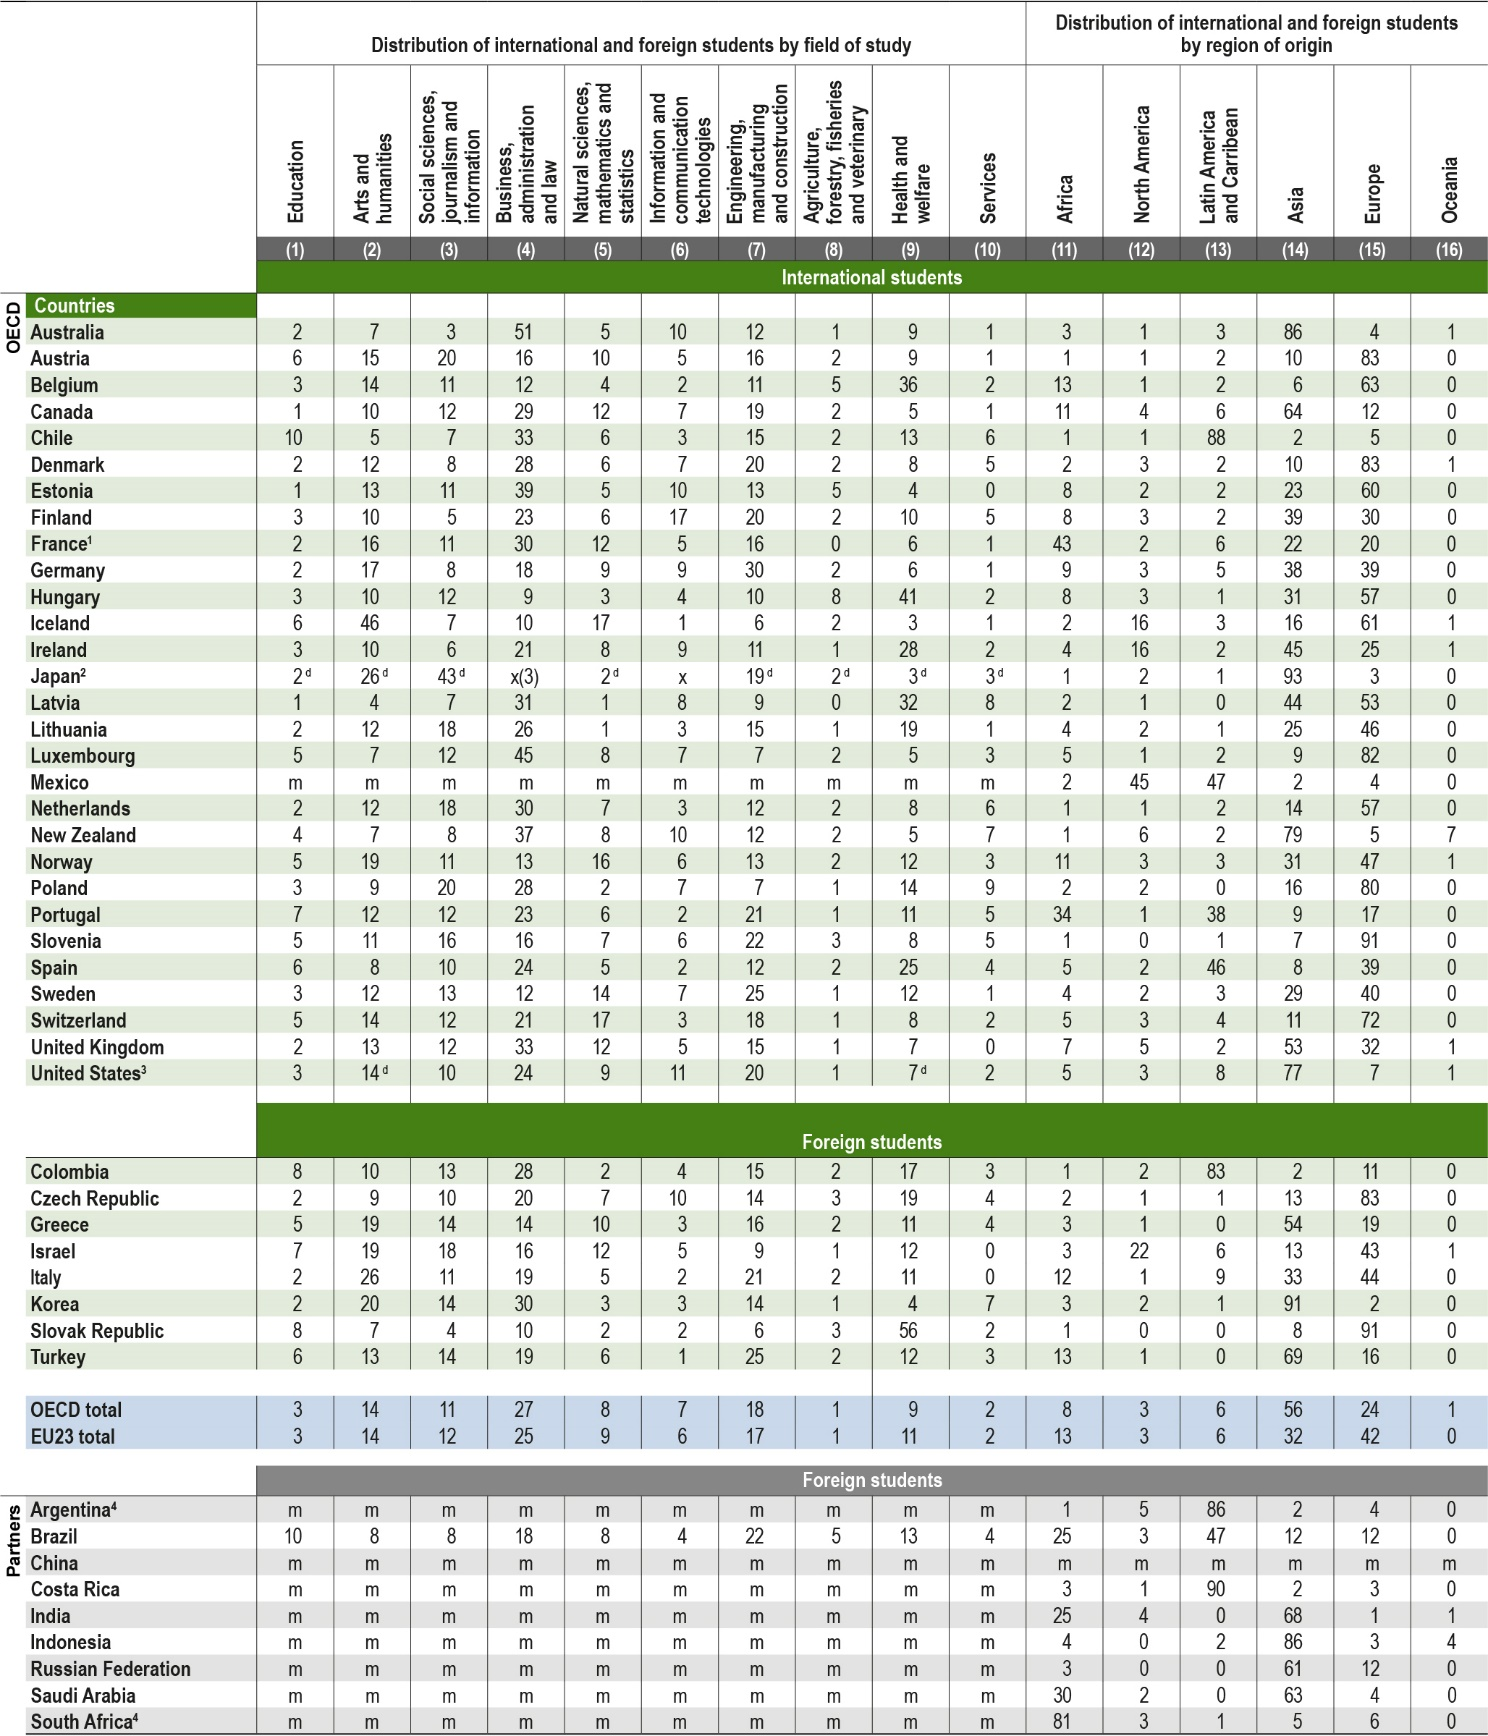 |
Note: This table does not present the shares of students enrolled in generic programmes and those whose region of origin is not known. |
1 The share of students by country of origin is based on citizenship criteria. |
1. Data on information and communication technologies are included in other fields. |
2. Column 2 includes all interdisciplinary programmes, Column 9 includes public administration programmes. |
3. Year of reference 2016. |
Source: OECD/UIS/Eurostat (2019). See Source section for more information and Annex 3 for notes (https://doi.org/10.1787/eag-2019-36-en). |
Please refer to the Reader's Guide for information concerning symbols for missing data and abbreviations. |
Table B6.3. Mobility patterns of foreign and international students (2017) |
|---|
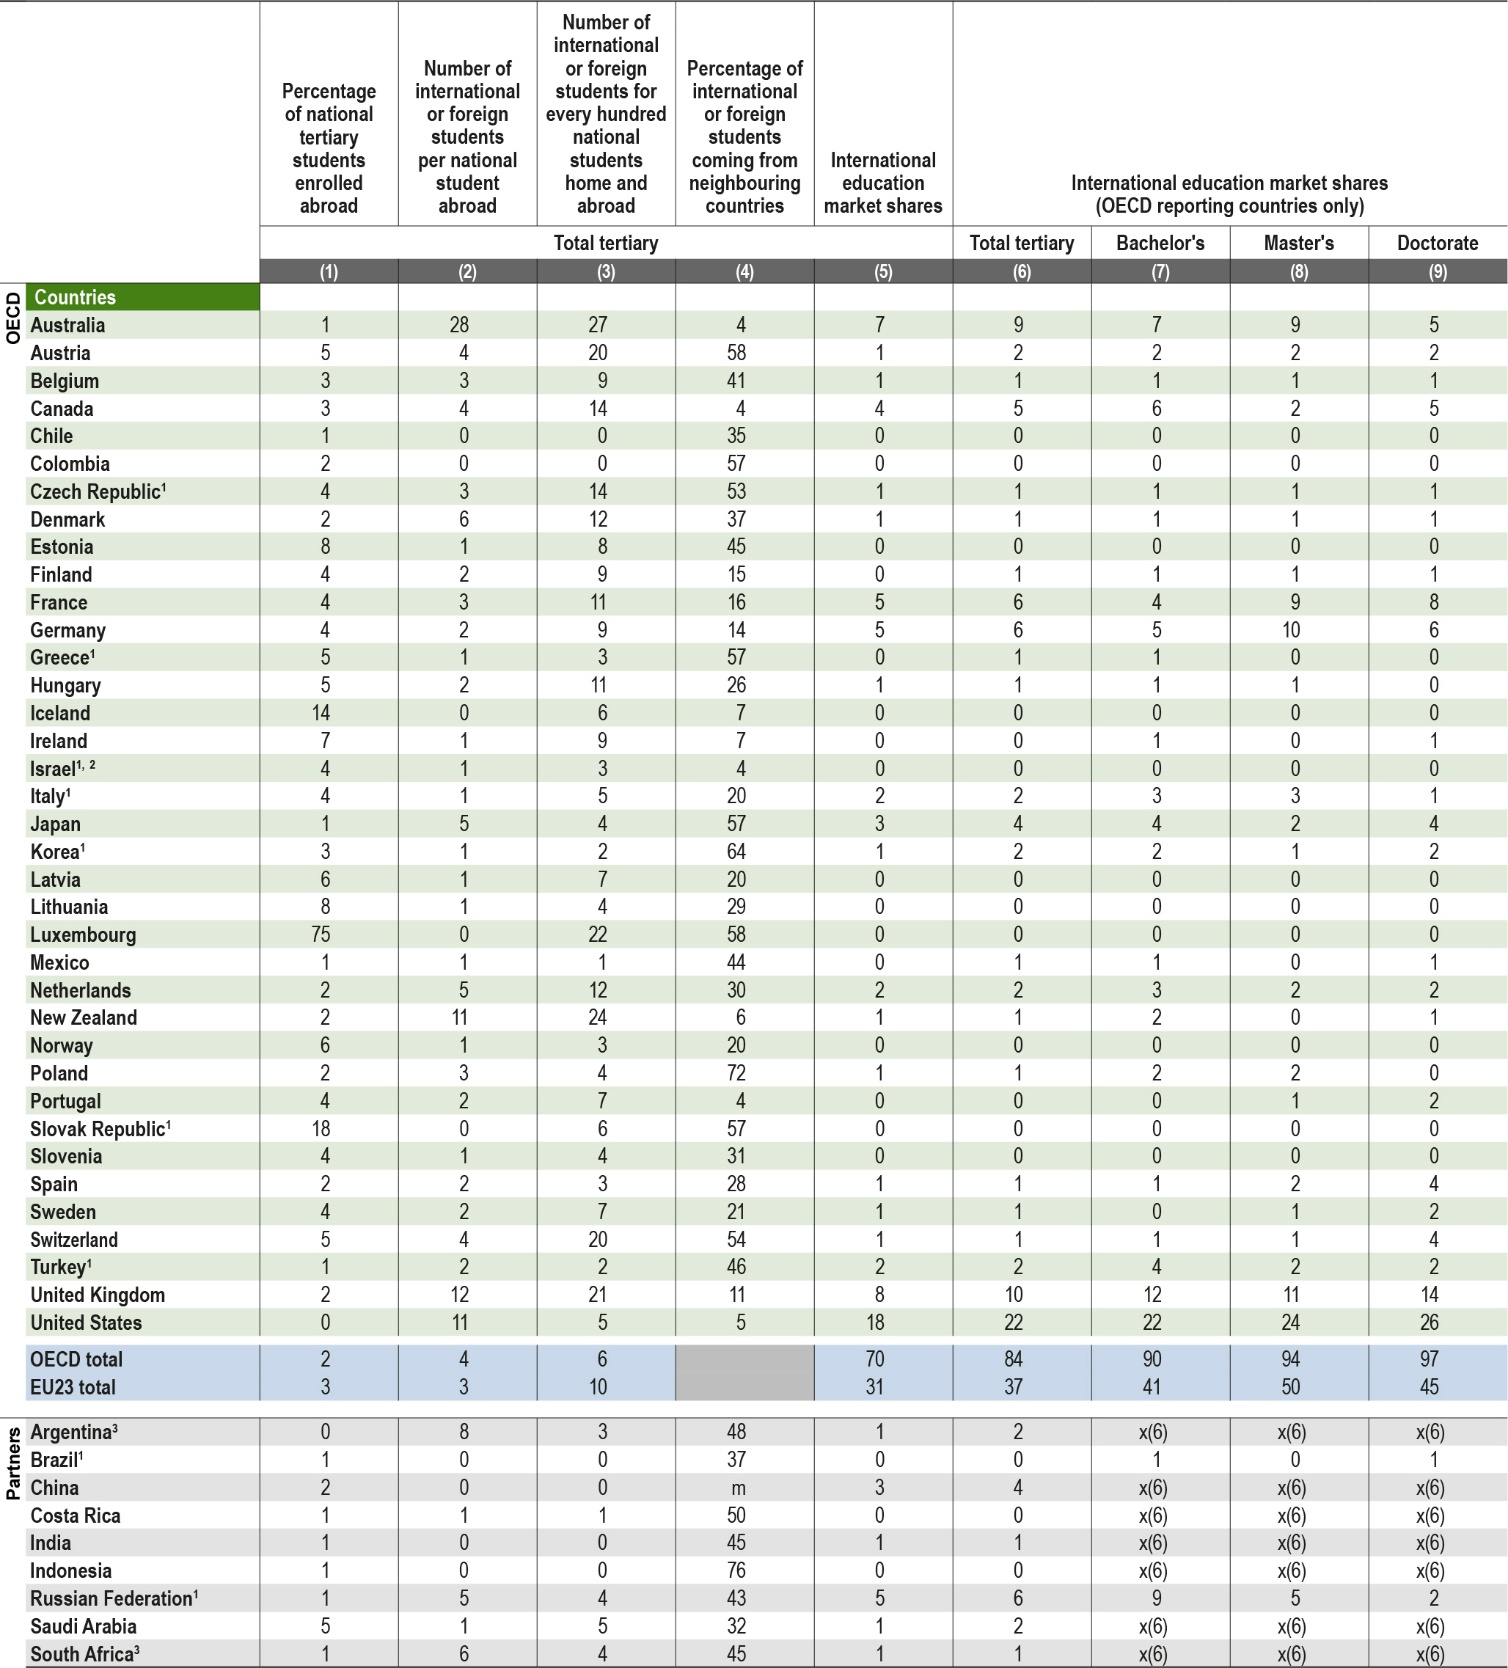 |
Note: Neighbouring countries are considered to be those with land or maritime borders with the host country. International education market shares refer to the number of mobile students enrolled in each destination country as a share of all mobile students (Column 5) or of all mobile students in OECD and partner countries (Columns 6-10). |
1. National tertiary students are calculated as total enrolment minus foreign students instead of total enrolment minus international students. |
2. Excluding internationally mobile students enrolled in short-cycle tertiary programmes. |
3. Year of reference 2016. |
Source: OECD/UIS/Eurostat (2019). See Source section for more information and Annex 3 for notes (https://doi.org/10.1787/eag-2019-36-en). |
Please refer to the Reader's Guide for information concerning symbols for missing data and abbreviations. |